Mapping
Naming the Map
The map_saver node will be used to save the map that will be visualized in RViz. The following describes how to define the name of the map to be saved. This must be done now before launching the mapping flow (for example, the MOV.AI Husky mapping flow).
To name the map to be saved –
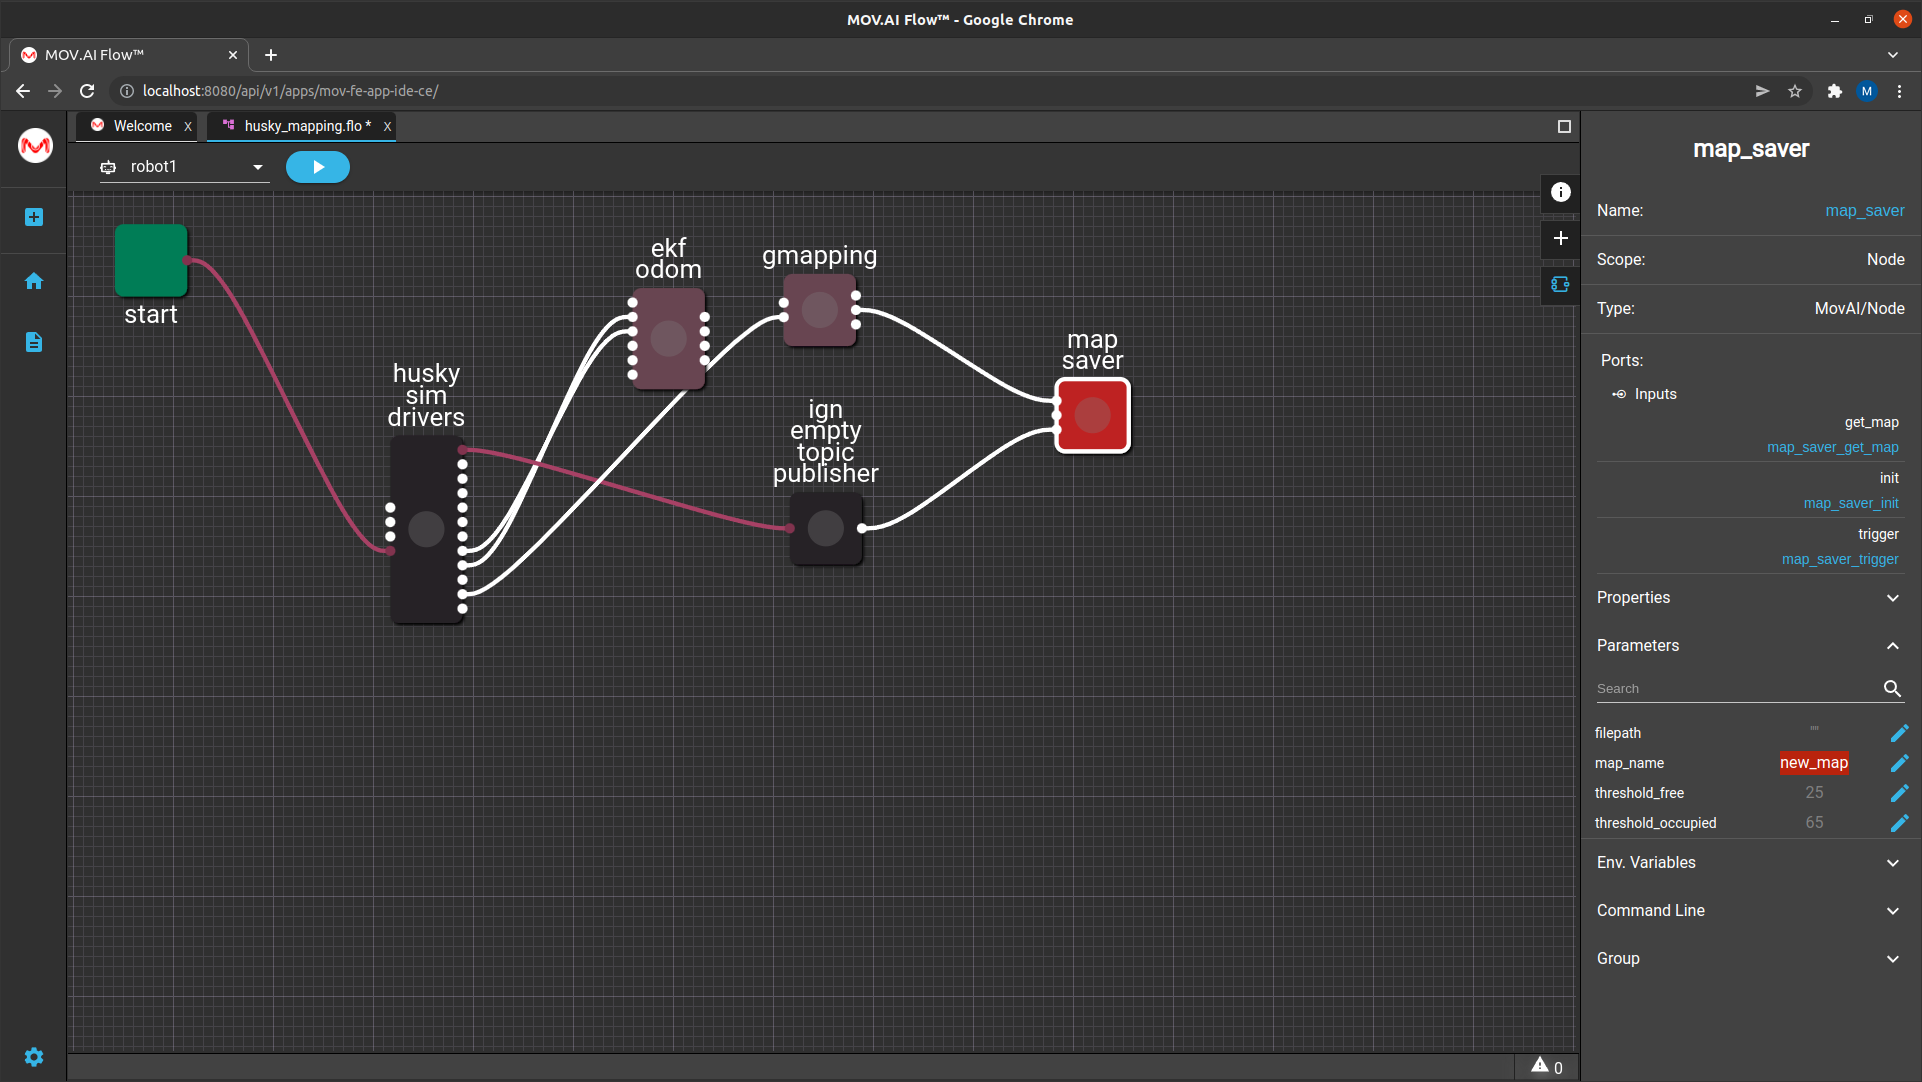
- In the MOV.AI Husky mapping flow, click on the map saver node and expand the Parameters section to display parameters in the right pane, as shown below –
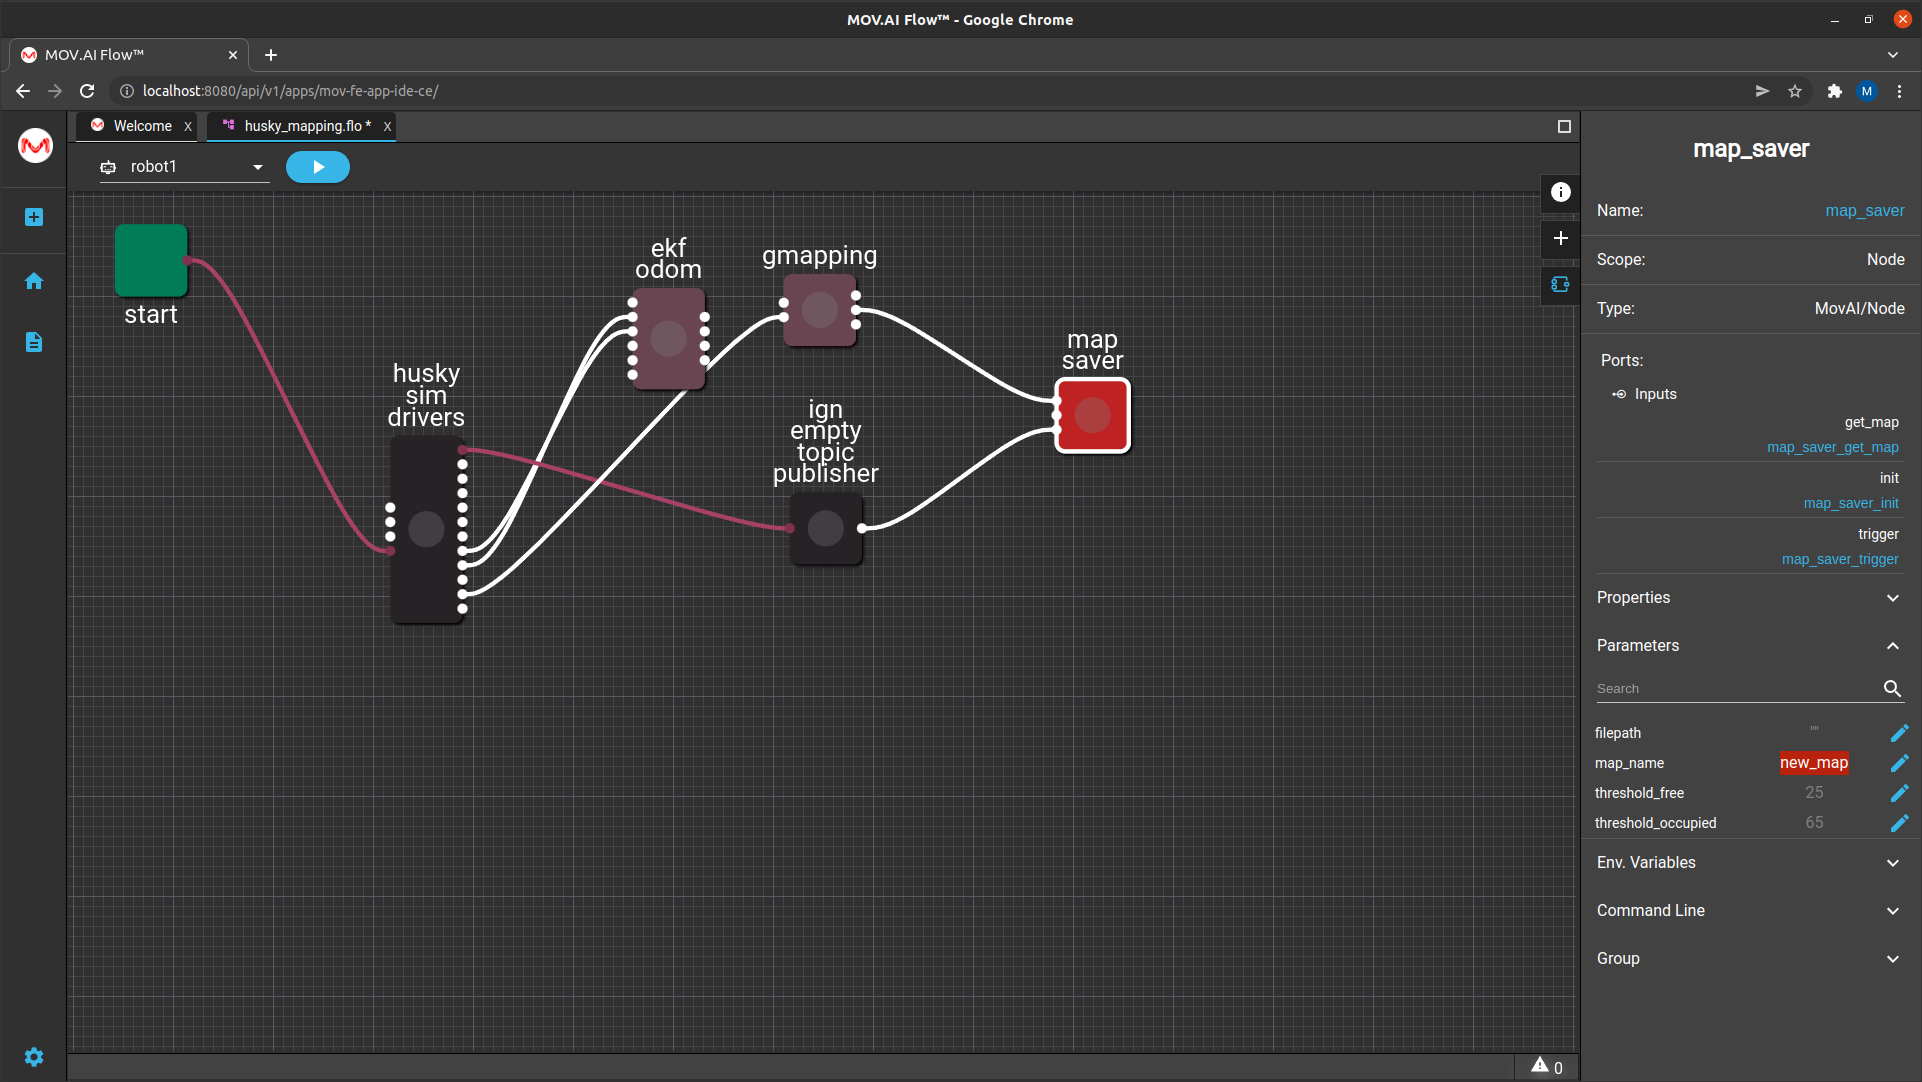
- Click the Edit
 button next to the map_name parameter to specify the name of the map that will be saved later. For example –
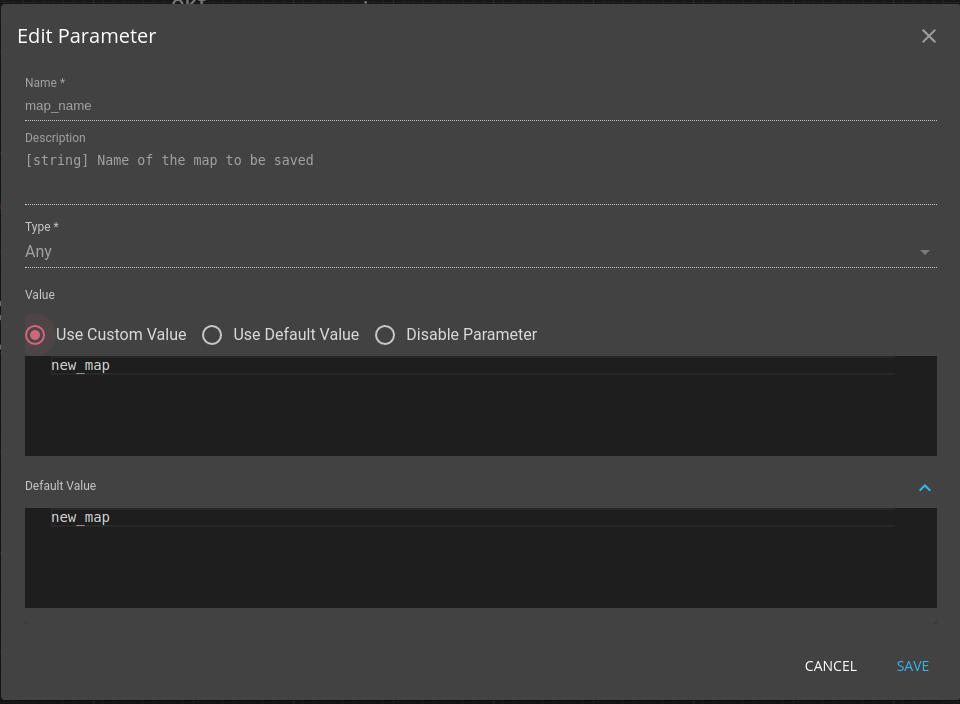
- Click the Save button.
Playing It
To start the mapping flow –
- Click the Play
 button in MOV.AI Flow.
Green dots start flashing on the nodes in the flow diagram on the right as they execute.
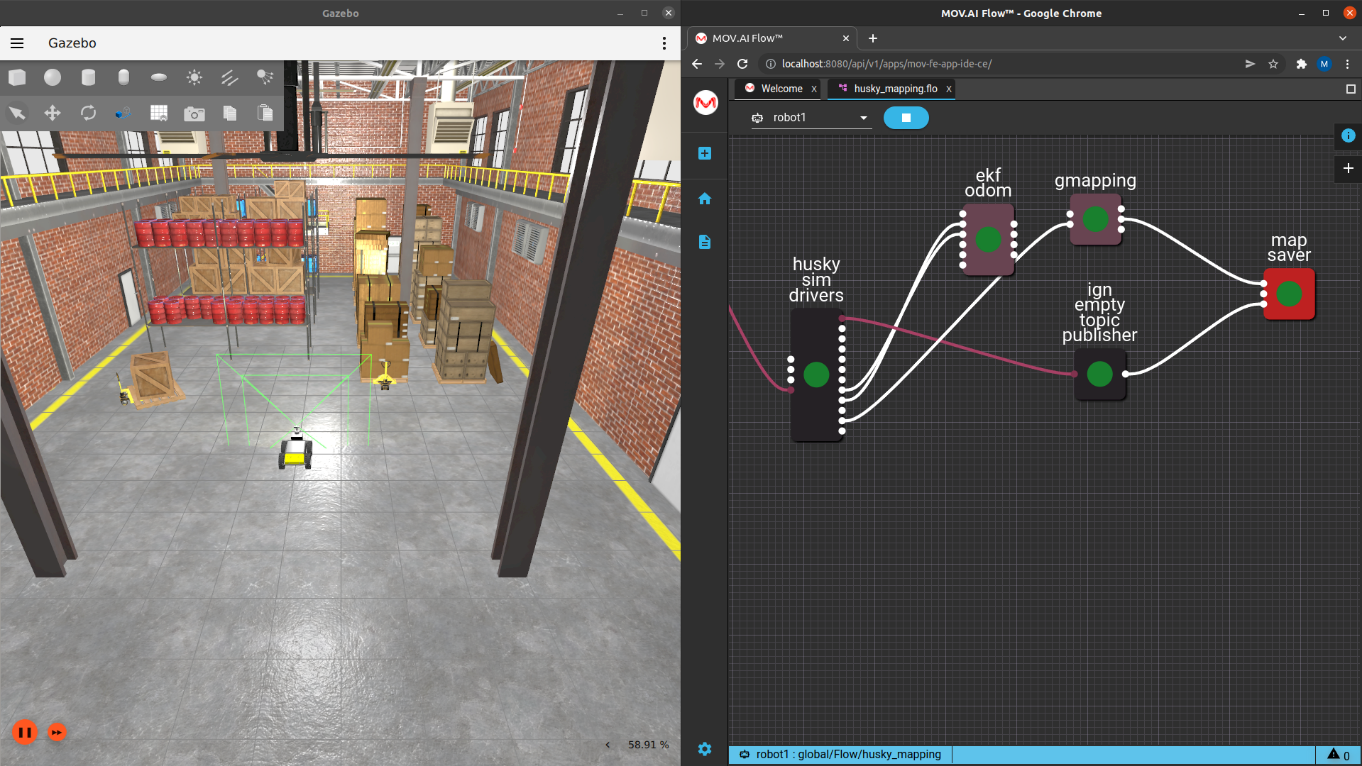
What Does RViz Show?
Redisplay RViz. Your desktop should look something like the following –
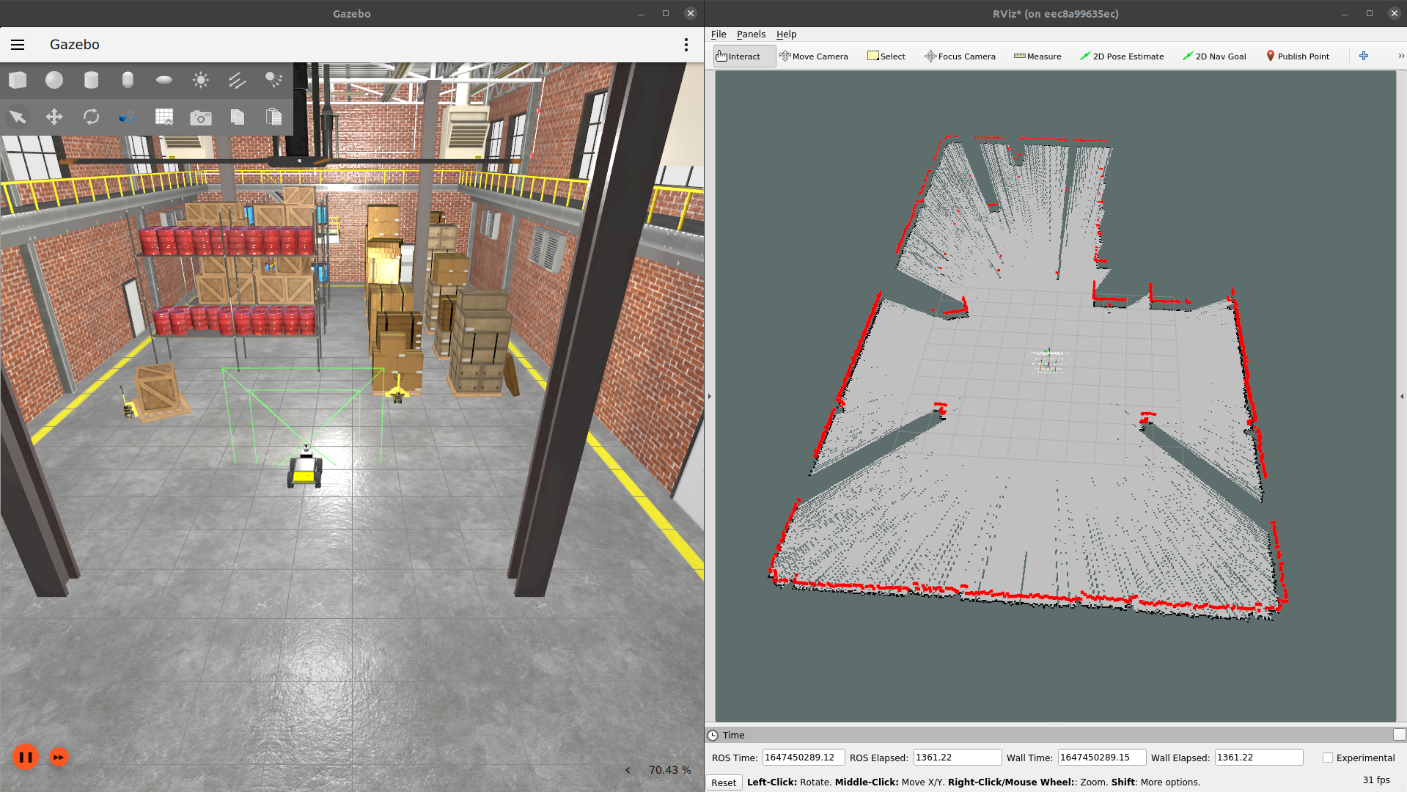
An image is displayed in RViz representing the map that is being built by the information collected by the Husky robot’s LiDAR sensor. This information is received by the MOV.AI flow from the Ignition simulator and sent to RViz. The map continually updates as the robot travels around.
- White – Represents the areas within the robot’s view that can be easily navigated.
- Olive Green – Represents the areas that the robot cannot detect, meaning that they are blocked by an obstacle.
This map currently reflects the height level seen by the robot. The robot appears in the center.
This view also indicates some of the objects that are blocking the robot’s view. You can tell where the obstacles are by the green coloring, which indicates that an obstacle is blocking the LiDAR’s view. For example, the pillar, the box on the left and the group of many large boxes on the right.
The edge of the area detected by the robot’s sensor (from where it’s standing) is represented by a colored line, as follows –
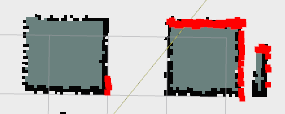
- Black – Represents the actual map that is generated in RViz when the LiDAR’s laser hits obstacles that the robot cannot navigate, such as shown along the wall and in front of each object that’s blocking the sensor’s view, as shown below –
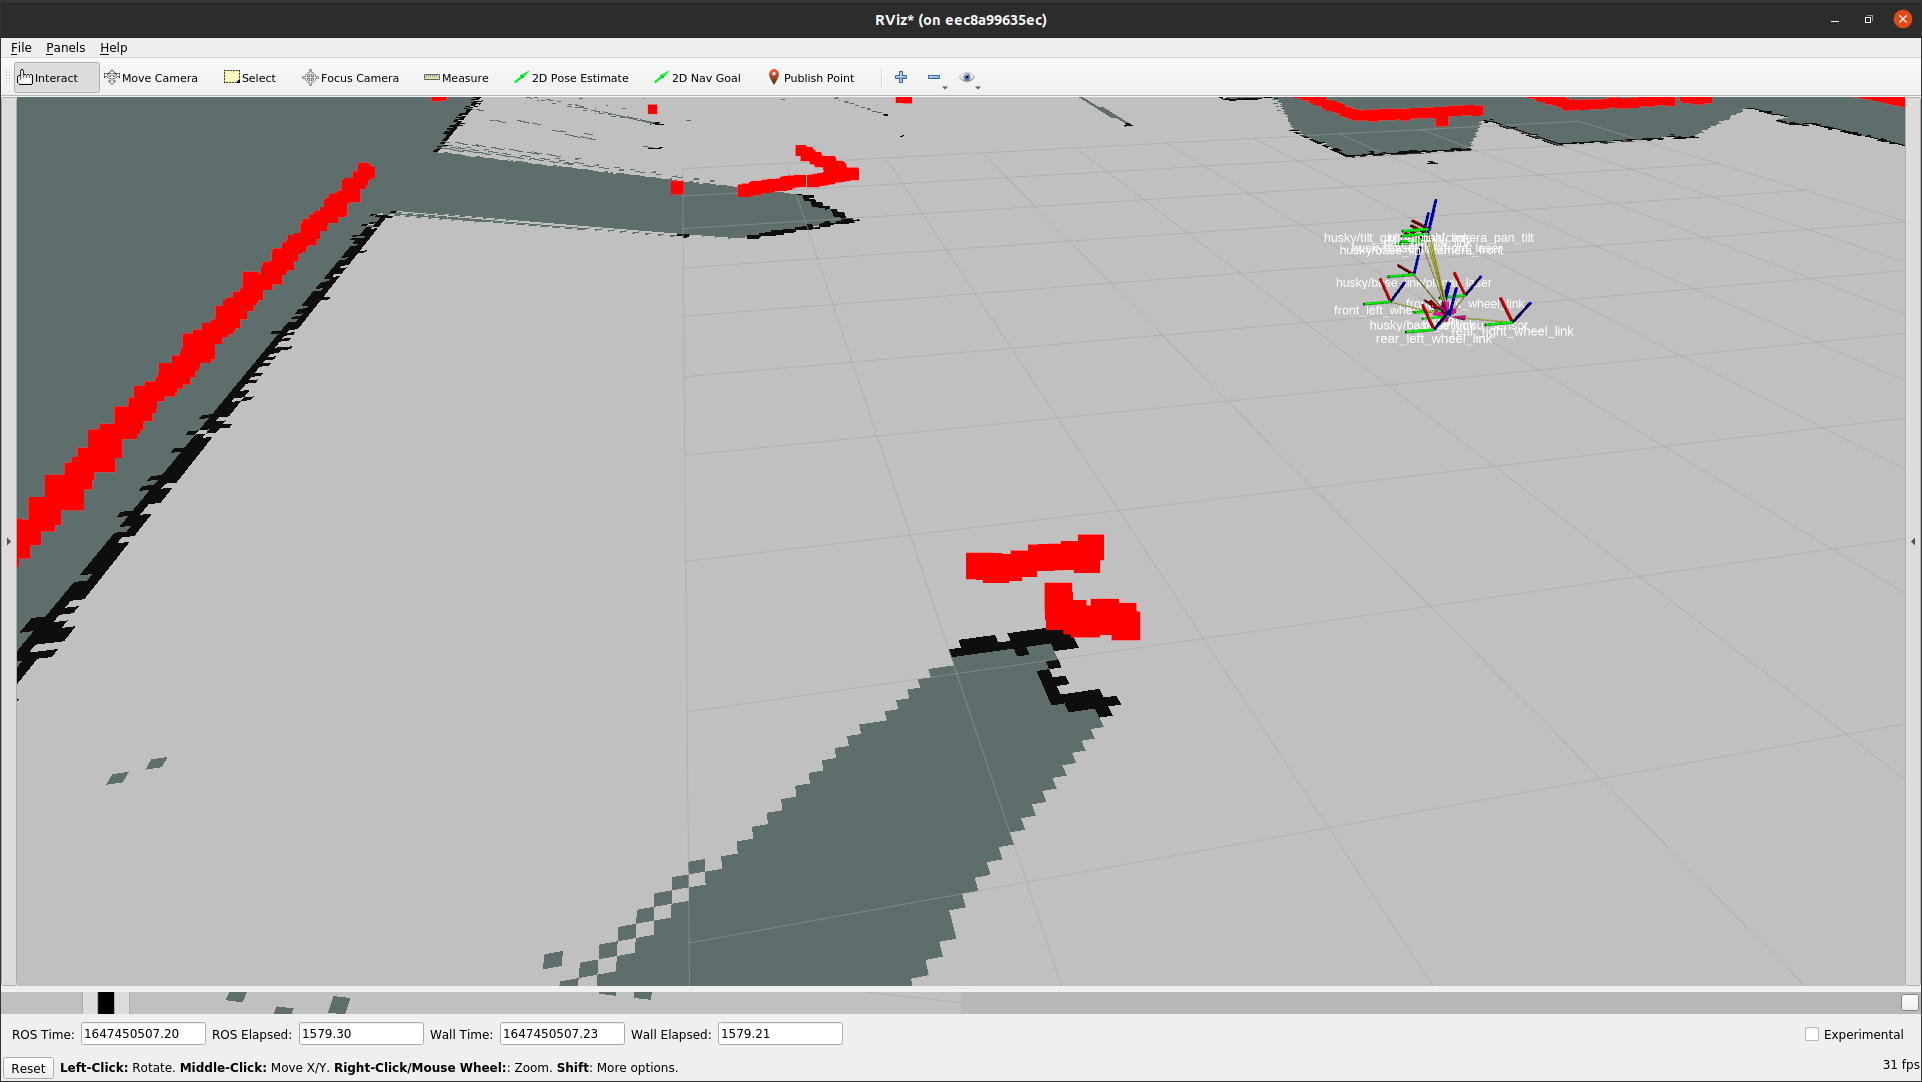
- Bright Green, Orange and Yellow – Represents laser points where the LiDAR’s laser hits objects. Each dot is like the end of a line that could be drawn from the robot to the object. These colors are determined by the configuration in RViz.
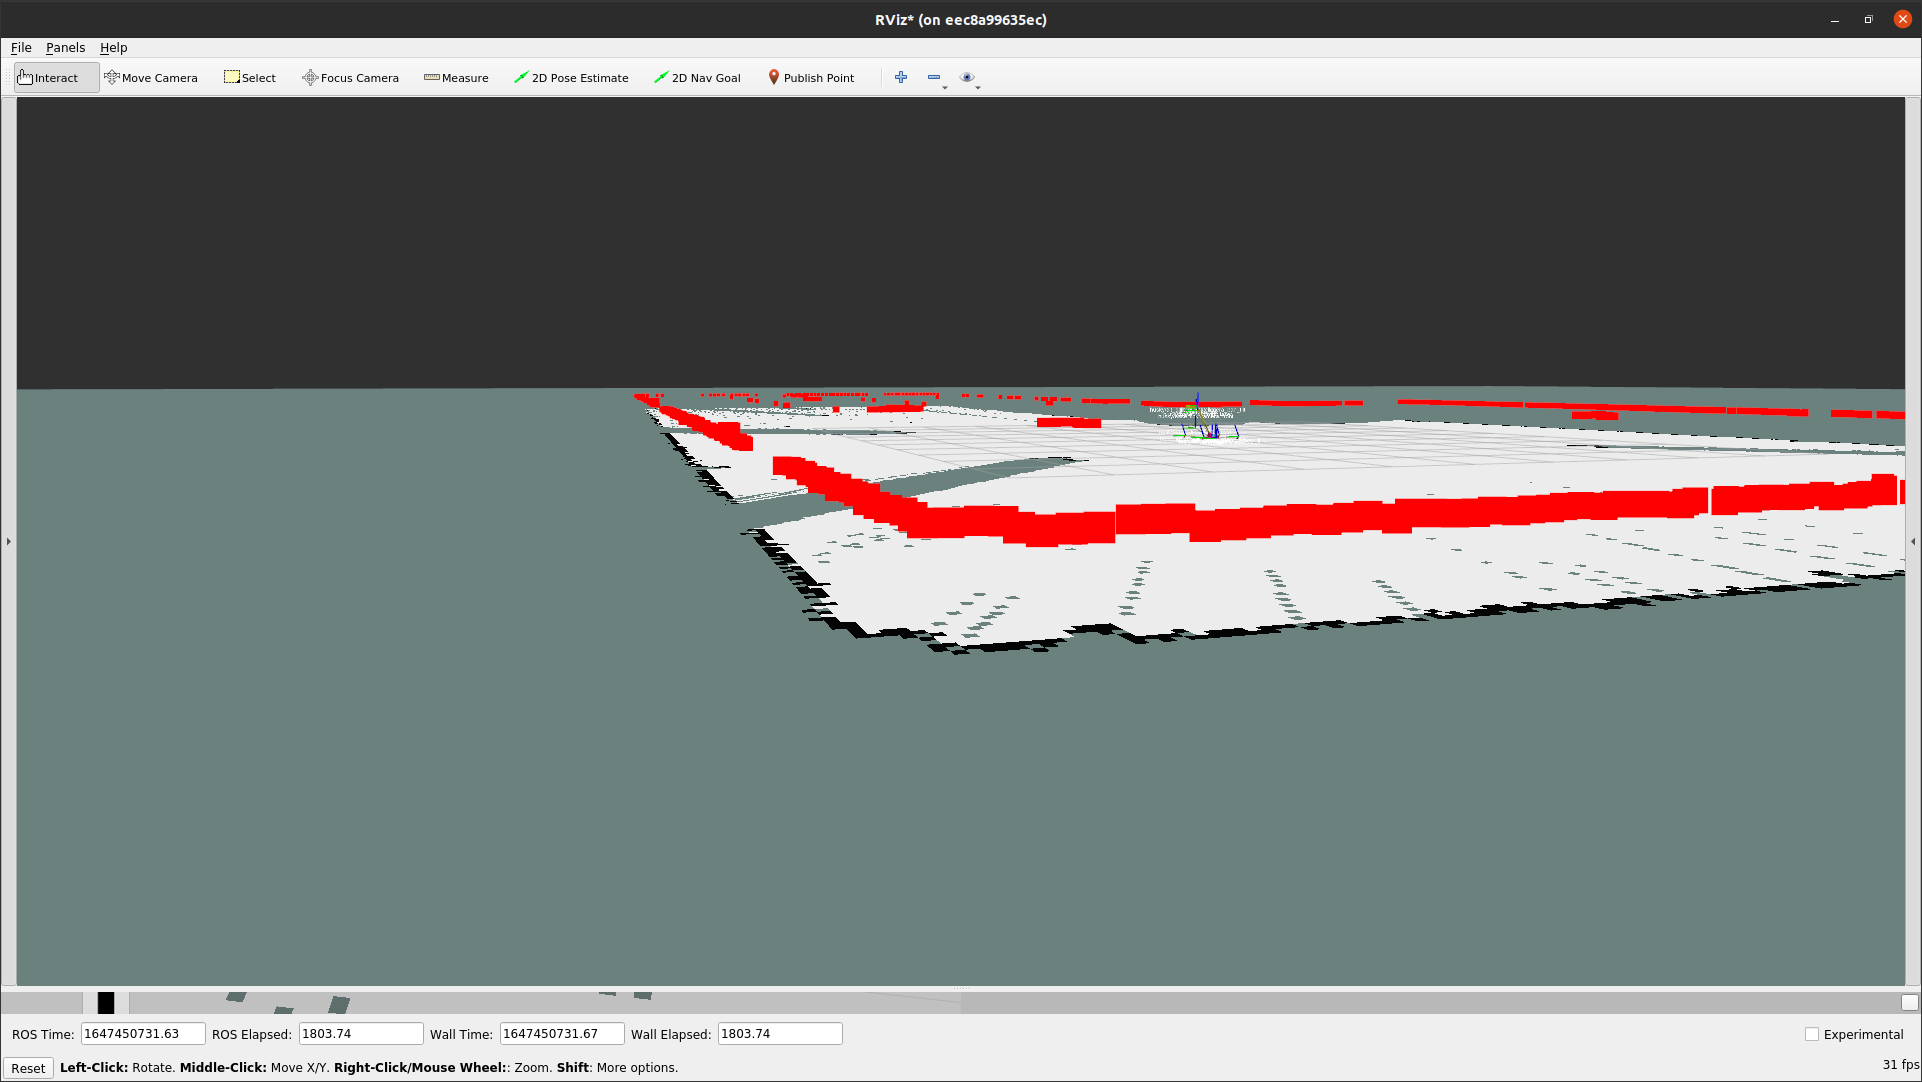
In the following picture, you can see that the colorful laser points seem to be above the floor. This is because they are at the height of the robot’s LiDAR sensor. The black points seem to be at floor level, because they represent the map that is being generated in RViz.
Manually Navigating the Robot
The following describes how to use the manual controls in Ignition Gazebo to navigate the robot around its entire environment. The robot must navigate around the entire area so that it can fill in information about the areas that it has not yet detected, such as behind the pillars, the boxes and so on. While using the navigation controls in Ignition Gazebo to move the robot around the environment, you will be looking at RViz, which visualizes the map so that you can see how much of the map has been completed and what’s left to finish.
It is important to make the robot navigate around the entire area so that there are as few unscanned (olive green) areas as possible.
For a description of the options in Ignition Gazebo, you may refer to its user guide at https://ignitionrobotics.org/docs/all/getstarted.
Here are a few pointers for using Ignition Gazebo.
To control the robot in Ignition Gazebo using the keyboard (Teleop) –
- Click the
 icon in the top right corner of the Gazebo window.
 - In the displayed search window, type Teleop and then click on it.
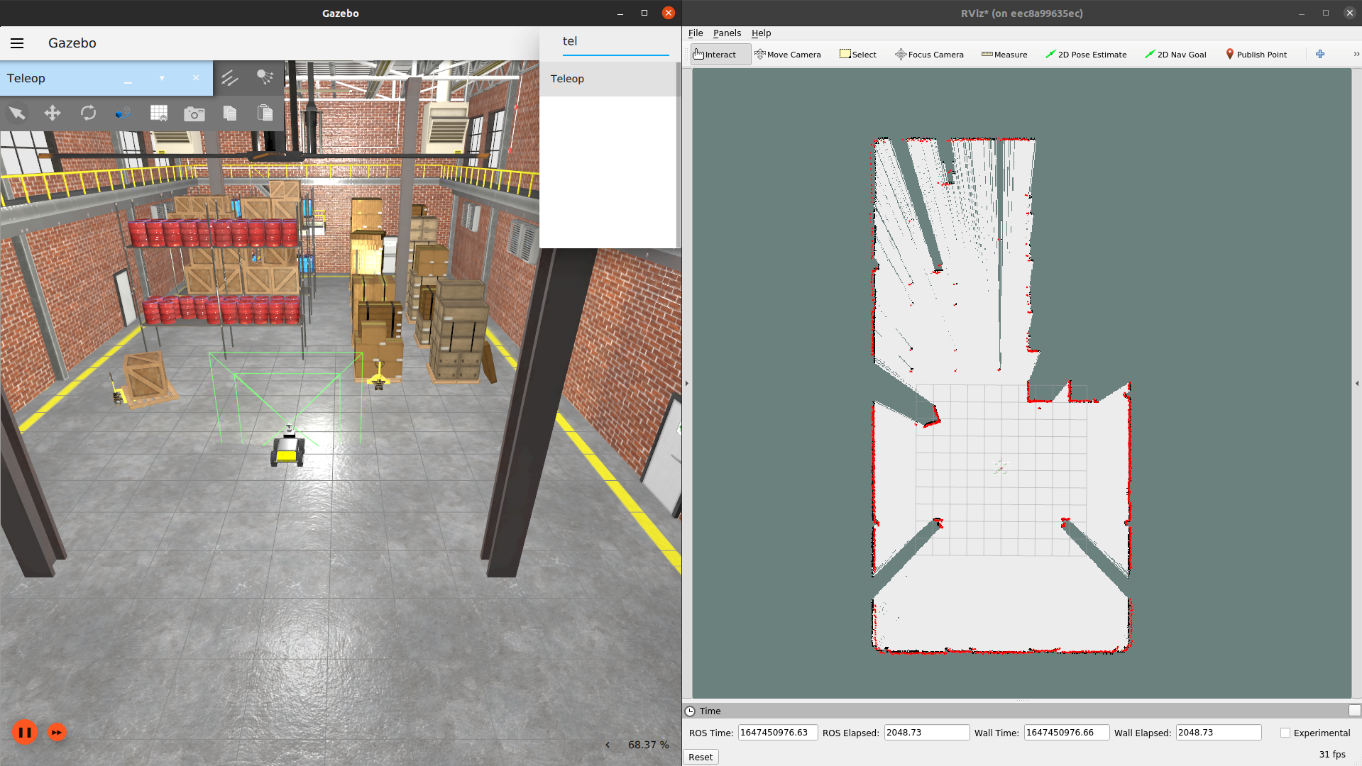
The following displays –
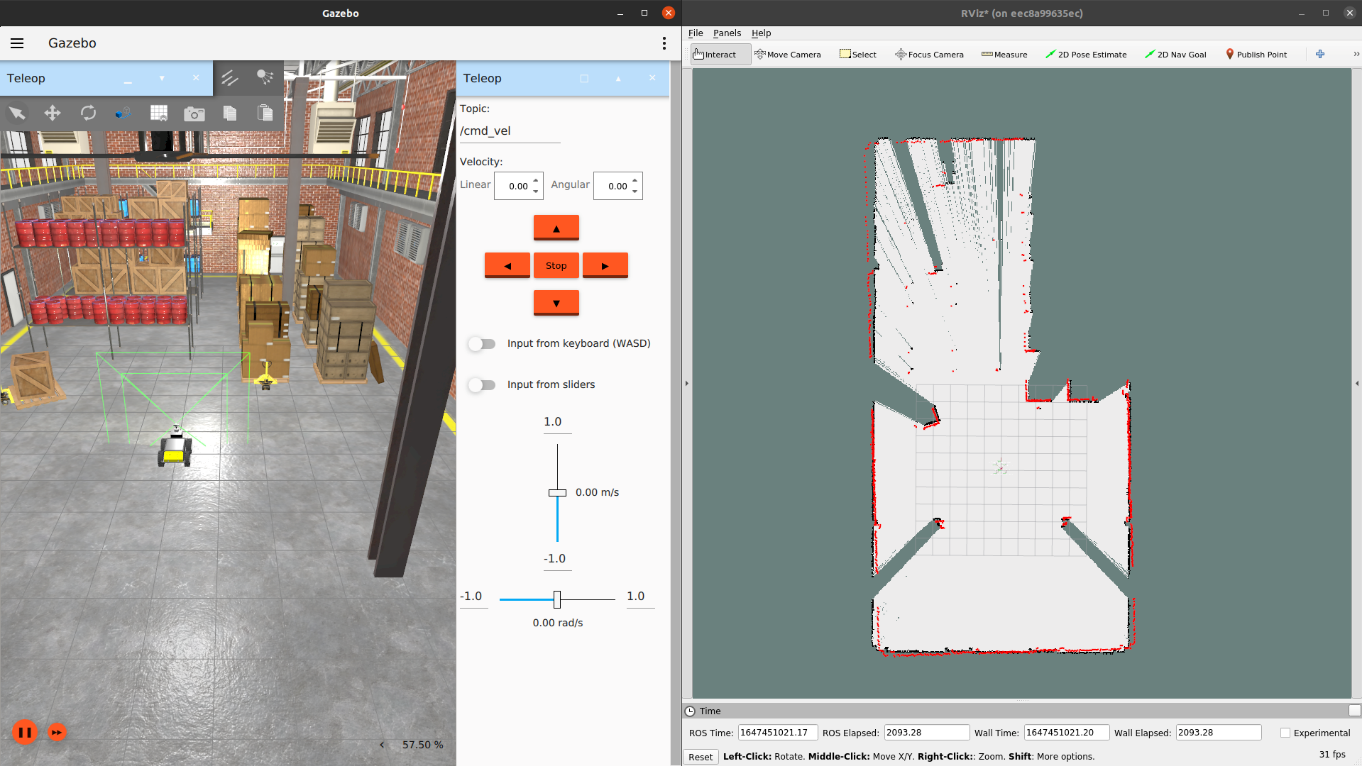
- In the Topic field, in the top of the Teleop pane, enter –
- For a Husky robot – /model/husky/cmd_vel
- For a Tugbot robot – /model/tugbot/cmd_vel
- In the Velocity: Linear field, specify the speed at which the robot will travel. For example, 1.00 represents 1 m/s.
- In the Velocity: Angular field, specify the angular speed at which the robot will turn. For example, 1.00 represents the speed of the robot’s rotation.
- Slide the Input from keyboard control to the right to indicate that you will be controlling the robot in the simulator using the WASD keys.
- The W and S keys represent forward and backwards
- The A and D keys represent left and right
The robot is represented on the map as follows –
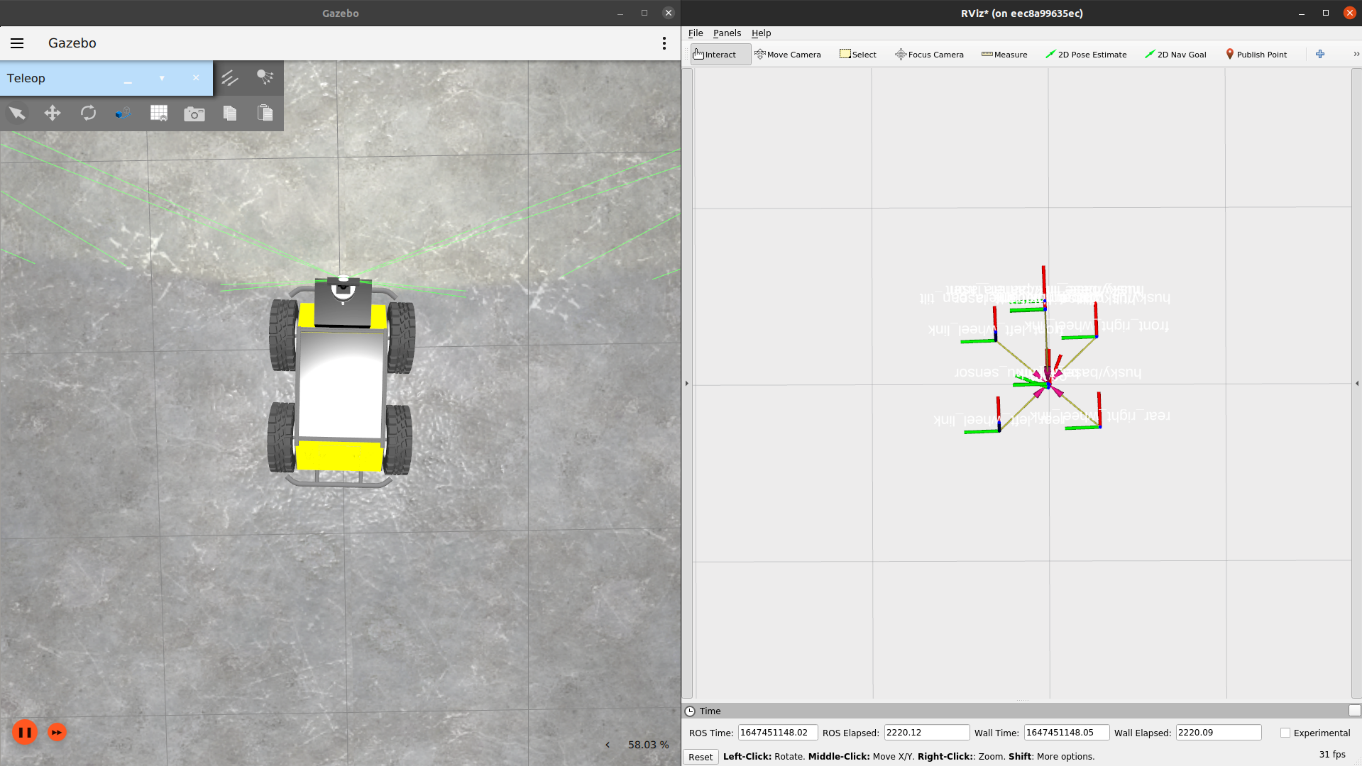
-
You can change the virtual camera’s view shown in the simulator as needed in order to see where the robot is. The example above shows a view looking down from the ceiling at the robot.
- In Ignition Gazebo, you can right-click on the robot and select Follow to specify that the camera in Gazebo follows the robot so that you can always see it. For example, when it is navigating behind boxes, as shown below –
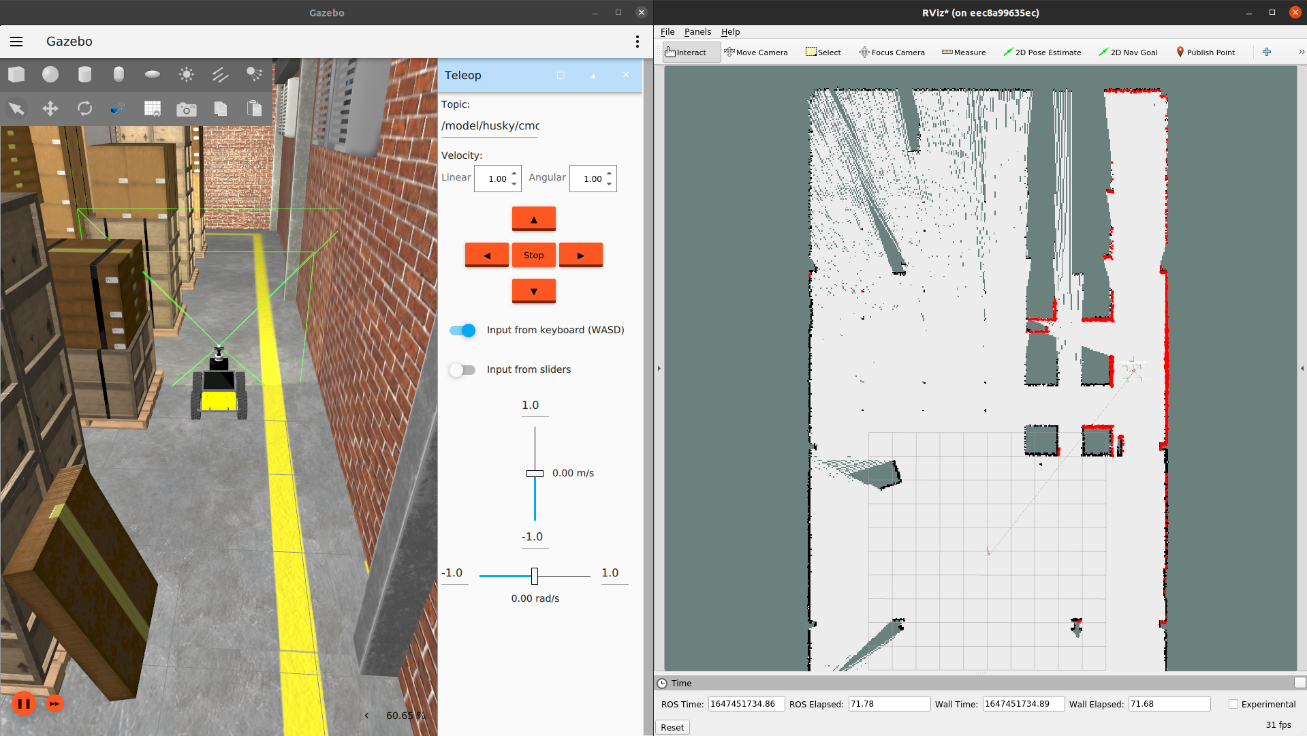
- The black rims represent the edges of solid objects while the olive green presents their insides. For example, as shown below –
Note – If the camera is pointing at an obstruction (such as when the robot is near a wall), you can click the ESC key to stop the camera from following the robot.
You cannot adjust the yaw of the robot after the flow has been started. The direction that the robot is pointing when the flow starts is considered to be yaw zero (0).
Note – This simulation automatically starts with the robot facing exactly toward the top center of the area to be mapped. This will later be considered the zero (0) yaw angle of the robot’s travel on this map. This will make it easier for you later when you must deal with giving yaw instructions for the robot to go to a specific position.
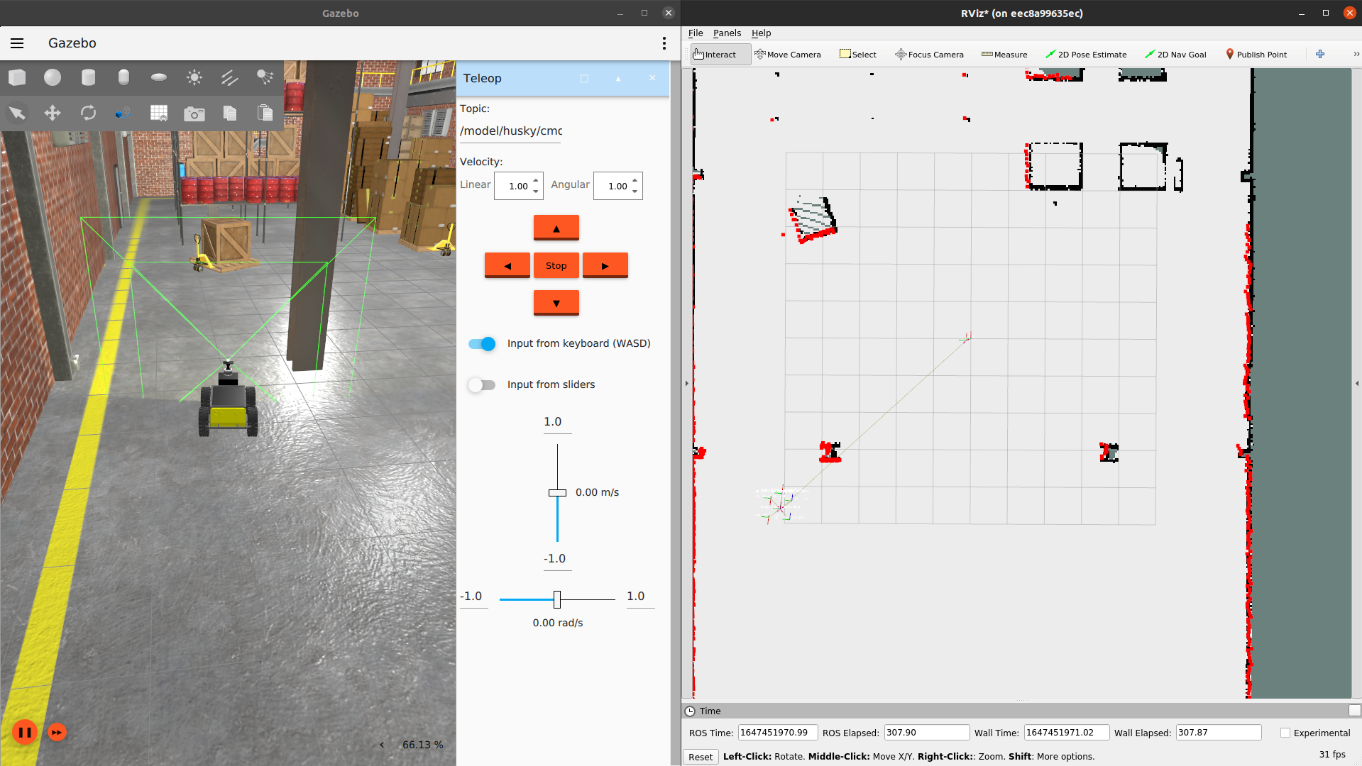
- Start moving the robot around the warehouse by pressing the WASD keys on your keyboard. As the robot travels around, the map reflected in RViz will be filled out with white fill and black lines to reflect the additional information received from the robot’s LiDAR sensor. For example, the following shows how the area behind the pillars has been filled in the map (with white fill and black lines instead of green fill) because by now the robot has traveled behind the pillars, as shown below –
- Make the robot travel around the entire environment until it has discovered all the areas behind obstacles so that all or almost all green areas behind obstacles have been filled in white color.
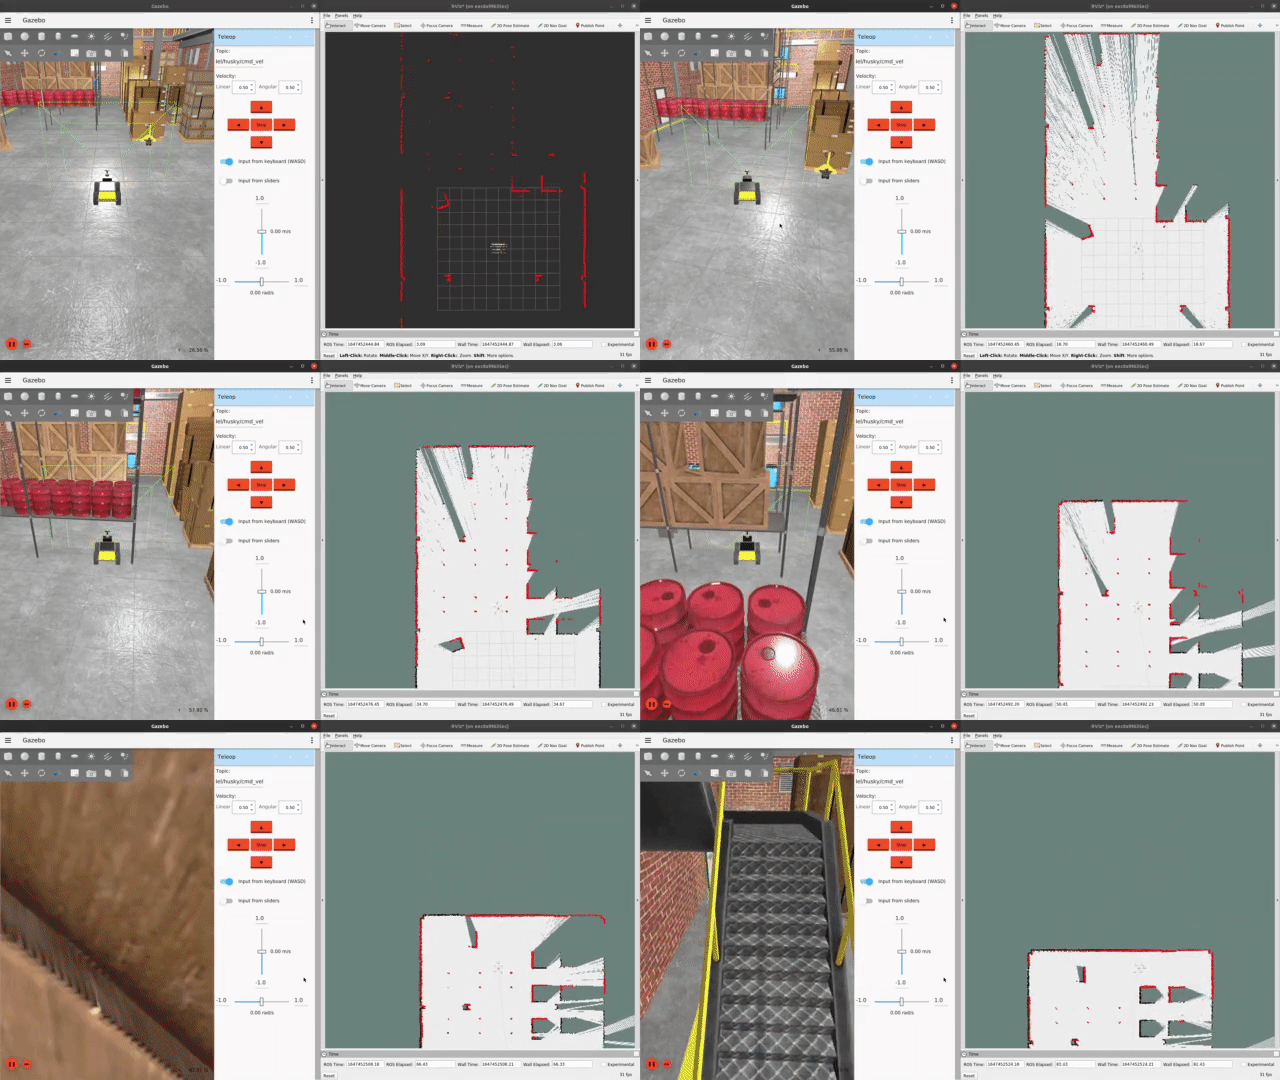
Here's a small taste. Click below to see the full video.
 Watch the steps!
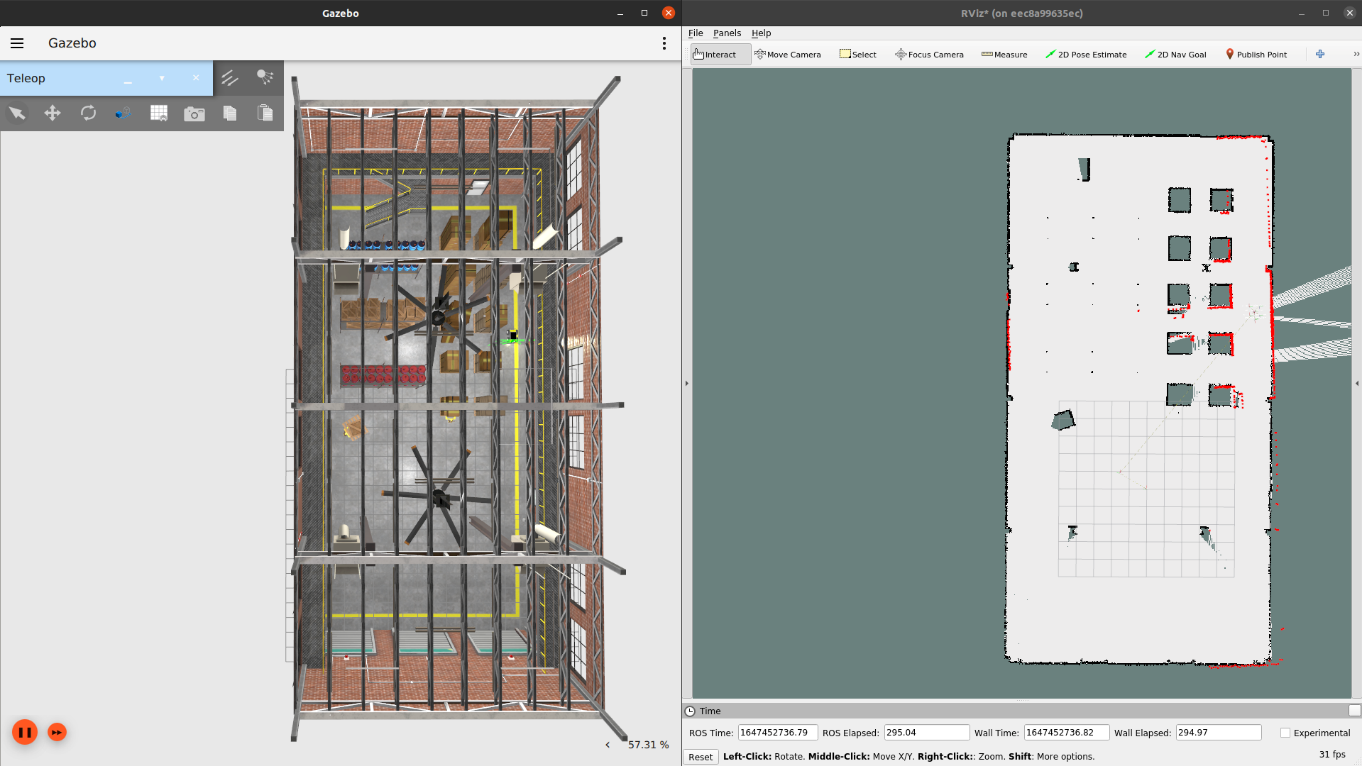
The following shows a map that’s almost complete. The only green areas that should remain should represent an obstacle to which the robot cannot travel, such as inside a box or pillar.
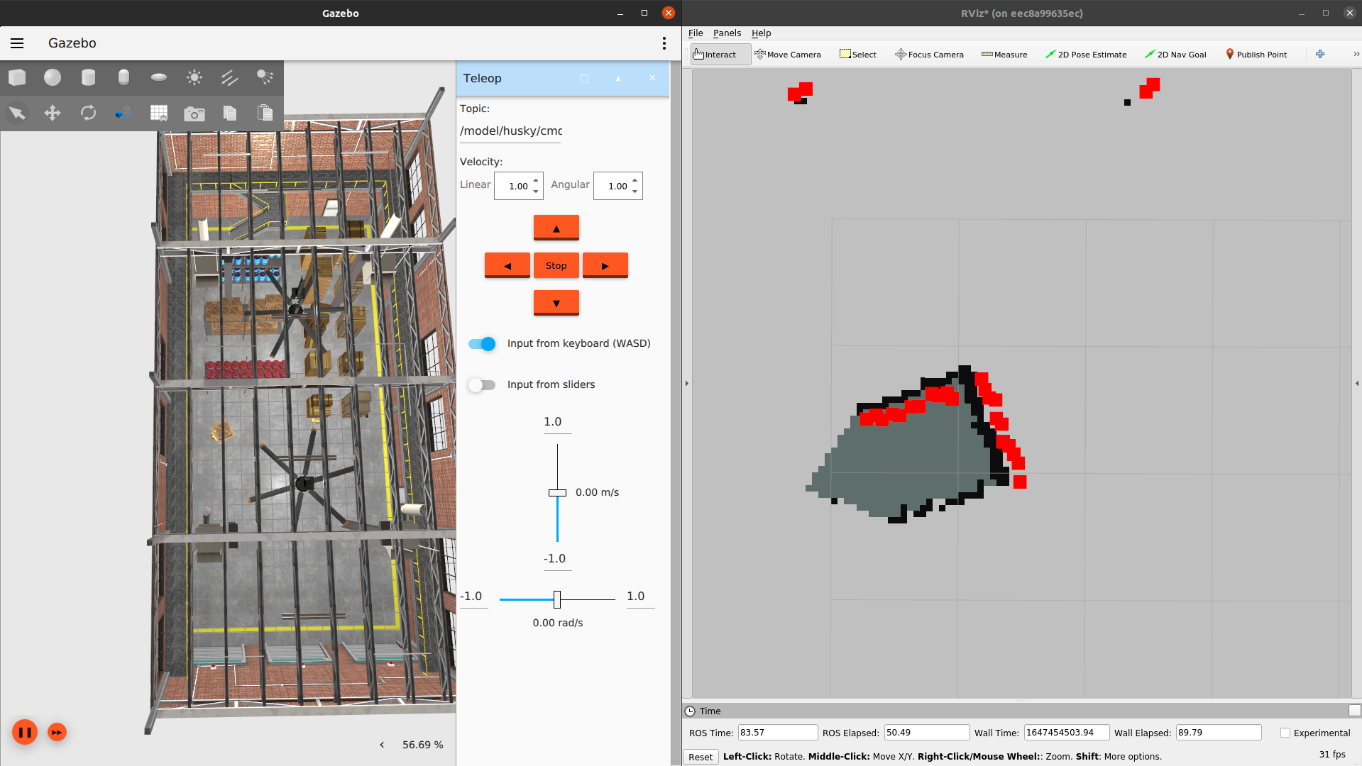
Proper localization depends on a good map. Because the black rims represent the edges of solid objects, while the olive green presents their insides, you must ensure that each solid object's outer rim is totally black. If it is not, make the robot travel around that area until its rim is black.
For example, the following shows how the top and left corners of this box have not been covered, because they’re not black –
Saving a Map
In the previous section, the map was generated on-the-fly and has not yet been saved.
The husky_mapping flow has a node named map_server, which will save the map, as described below.

Note – The map saver node is Protocol ROS1/Subscriber and has a trigger input port that runs a callback named map_saver_trigger.
This callback is activated by a message received from the ign empty topic publisher node (which receives a map save message from the Ignition Gazebo simulator).
When this message arrives, the map saver node saves the map information that was received from the gmapping node, as shown below –
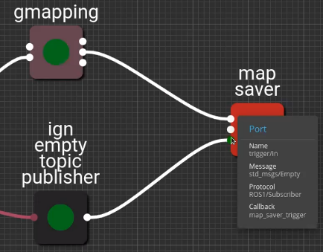
When you hover over the input port (dot) named trigger/in (which appears in green), a popup is displayed indicating that this port is able to receive a message of type Empty.
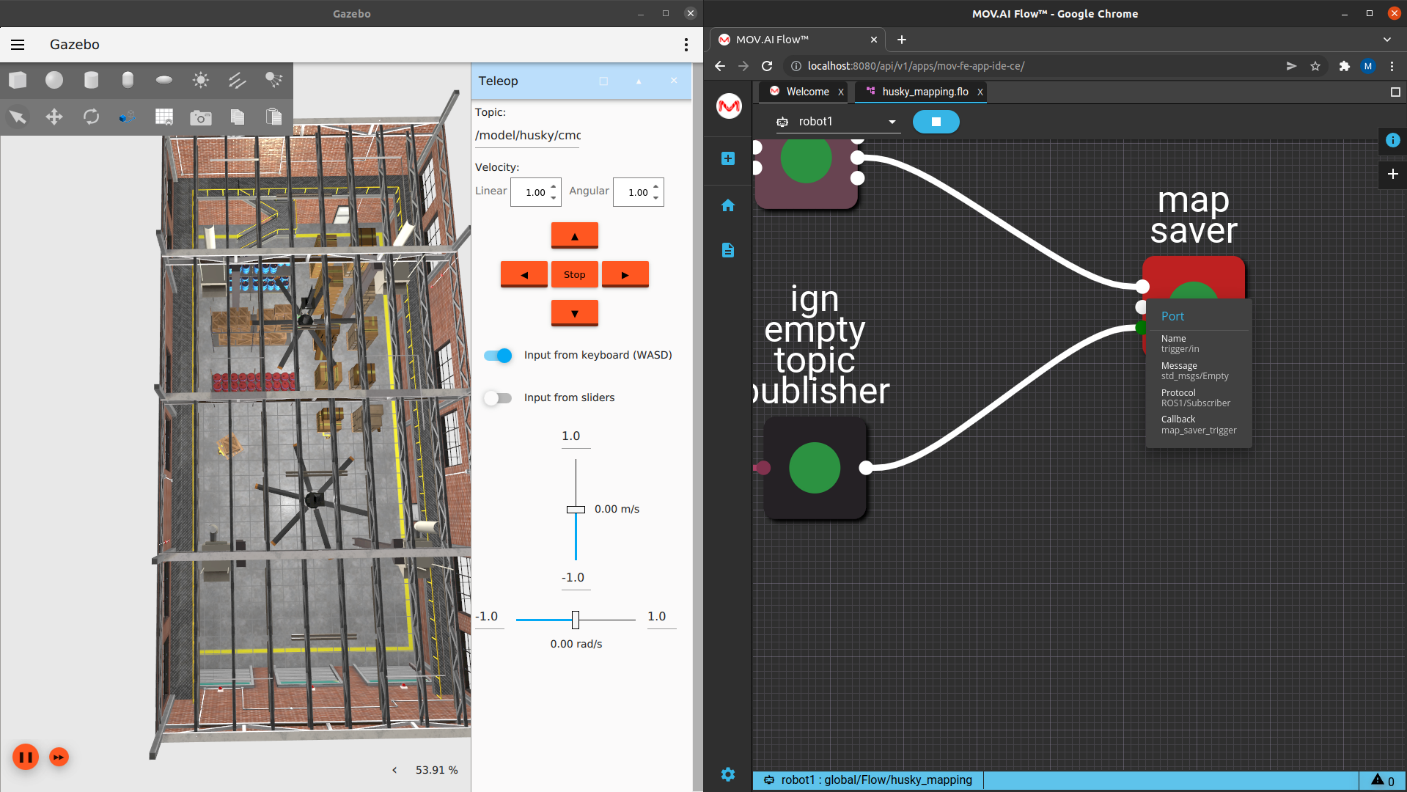
When you publish an Empty message to this node, a callback is triggered that saves the map.
Note – You can refer to Defining the Callback Code That Is Triggered by a Port for a description of how callbacks are triggered by messages received by node ports.
To trigger the ignition gazebo simulator to save the map –
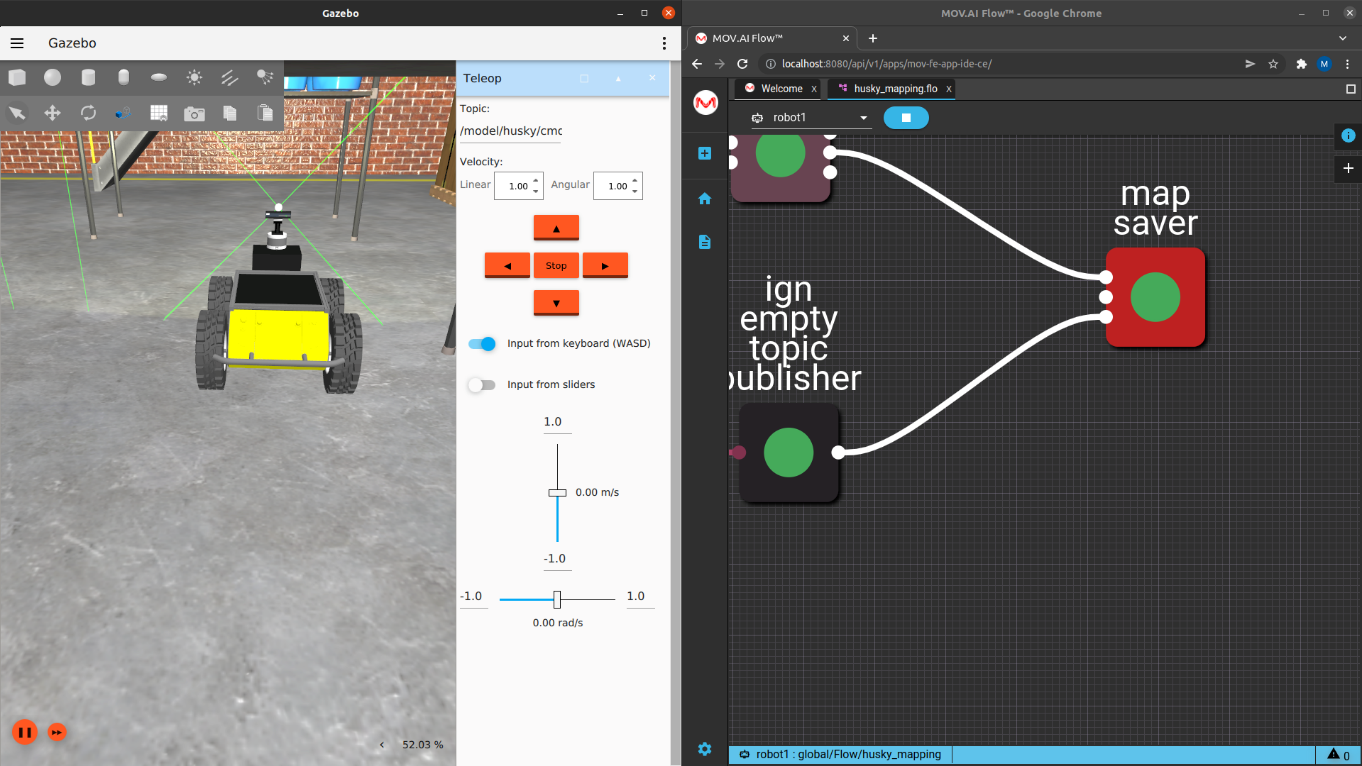
- Close the right pane in Gazebo, by clicking on the
 at its top right, as shown below –
- Click the
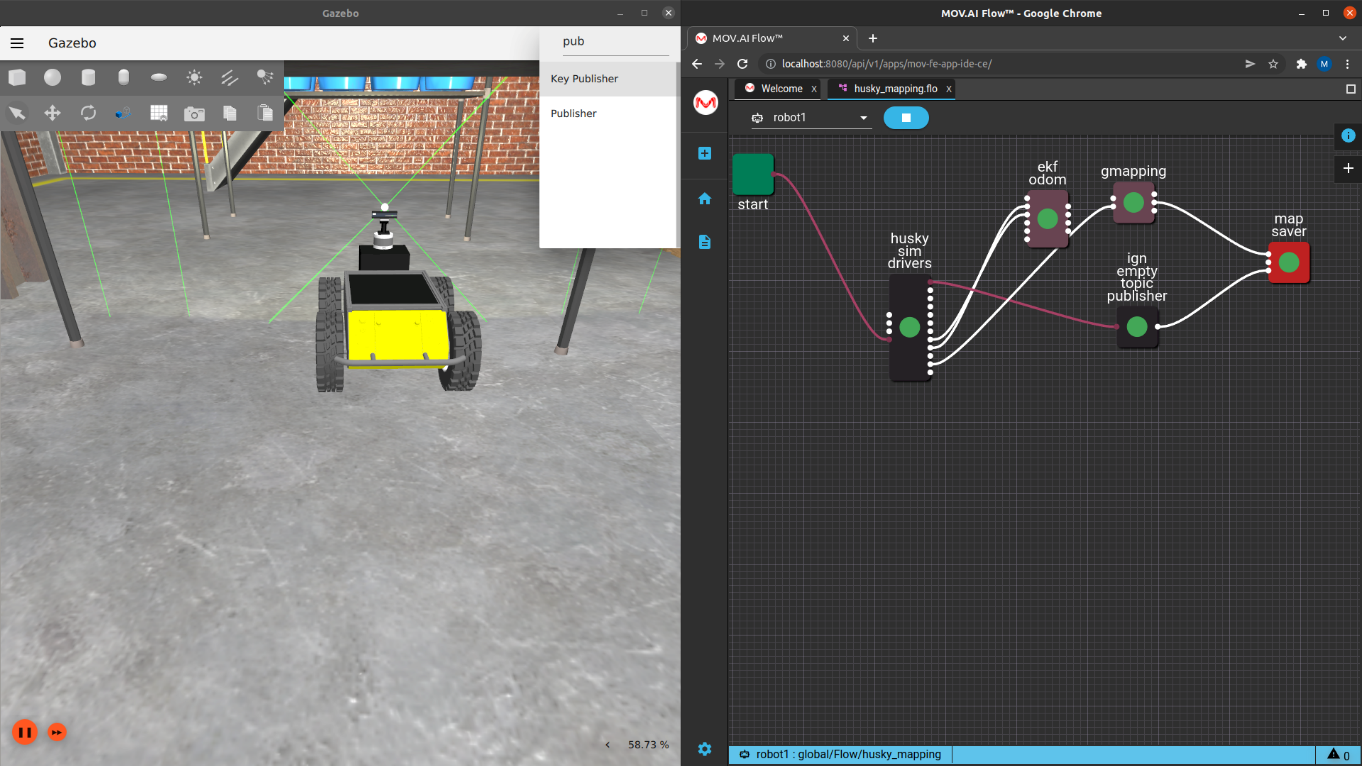
 icon in the top right corner of the Gazebo window.
 - In the displayed search window, type Publisher. The following displays –
- Click the Publisher option. The following displays, which enables you to configure the message that will be published by the Ignition Gazebo Simulator–
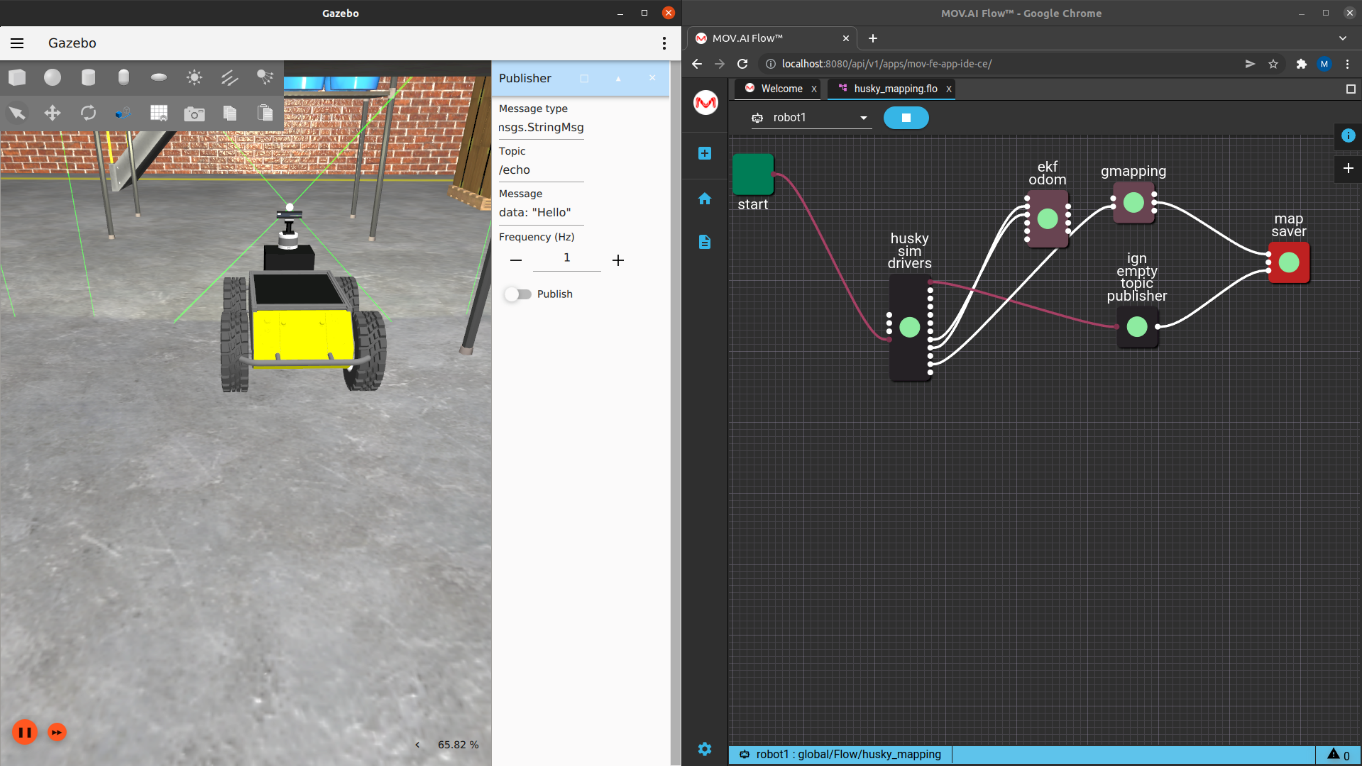
- In the Message Type field, change ignition.msgs.StringMsg to ignition.msgs.Empty.
- In the Topic field, change /echo to /save_map.
- Delete the value in the Message field and leave it empty. The form should now appear as follows –
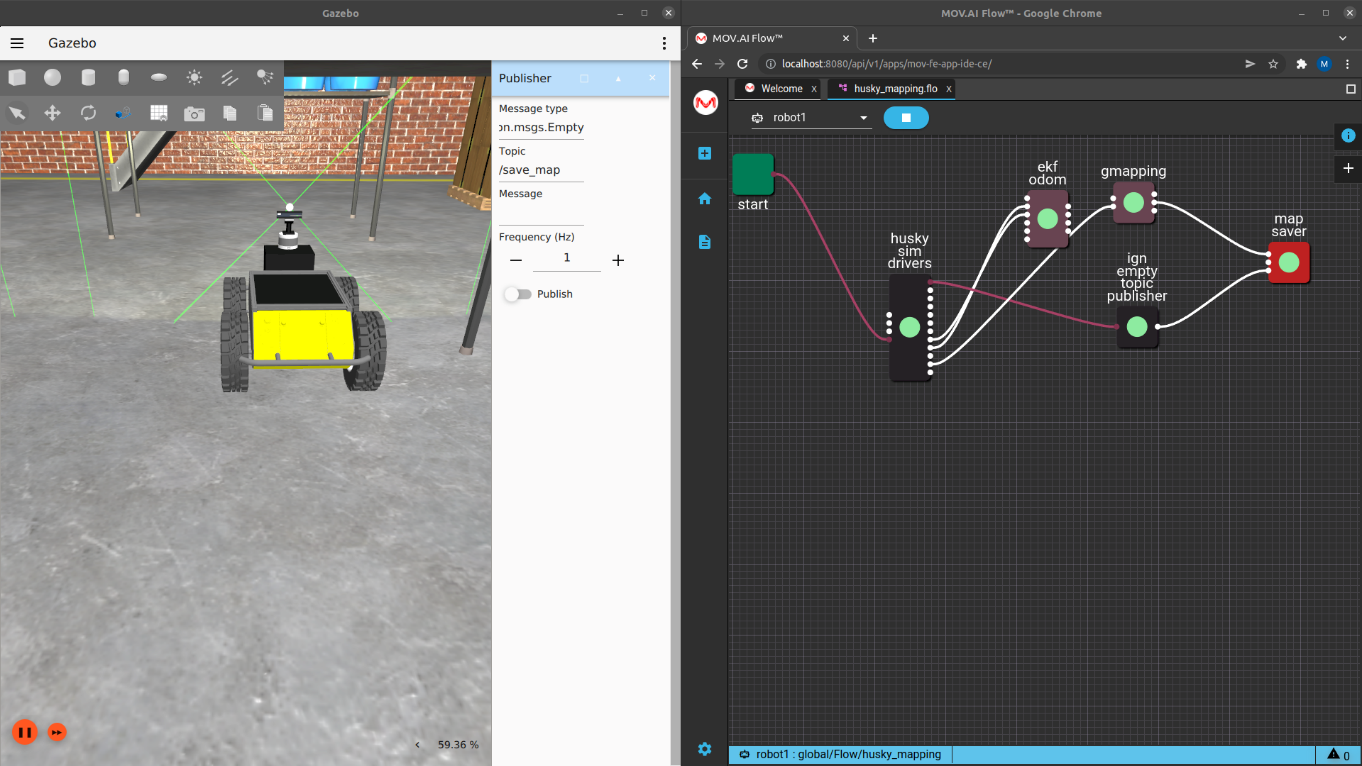
- Click the Publish slider to move it to the right, so that it appears as follows –
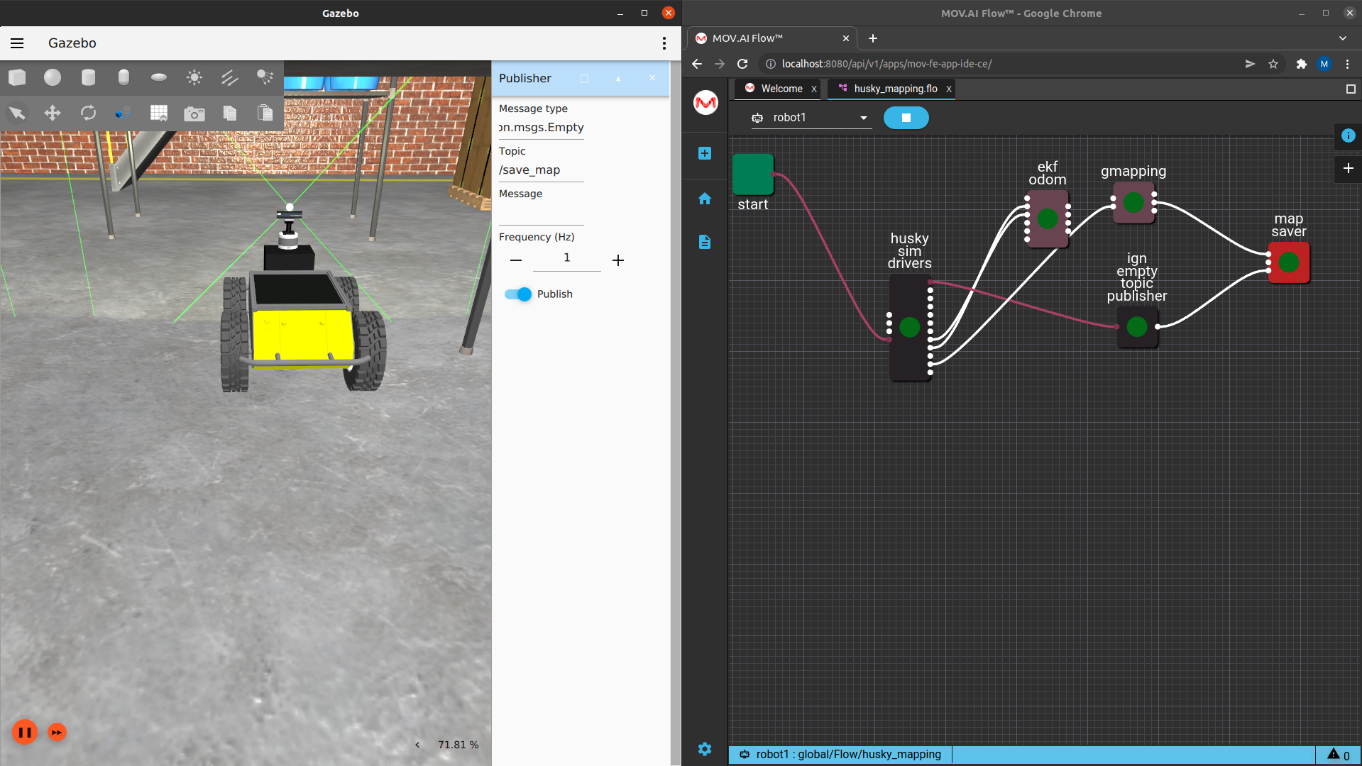
- After one or two seconds, click the Publish slider to move it back to the left.
- To confirm that the map is saved you can search for it, as described in this next step.
Visualizing the Saved Map
The following describes how to visualize the map after it has been saved using MOV.AI and RViz, as described in the Saving a Map topic above
To visualize the saved map –
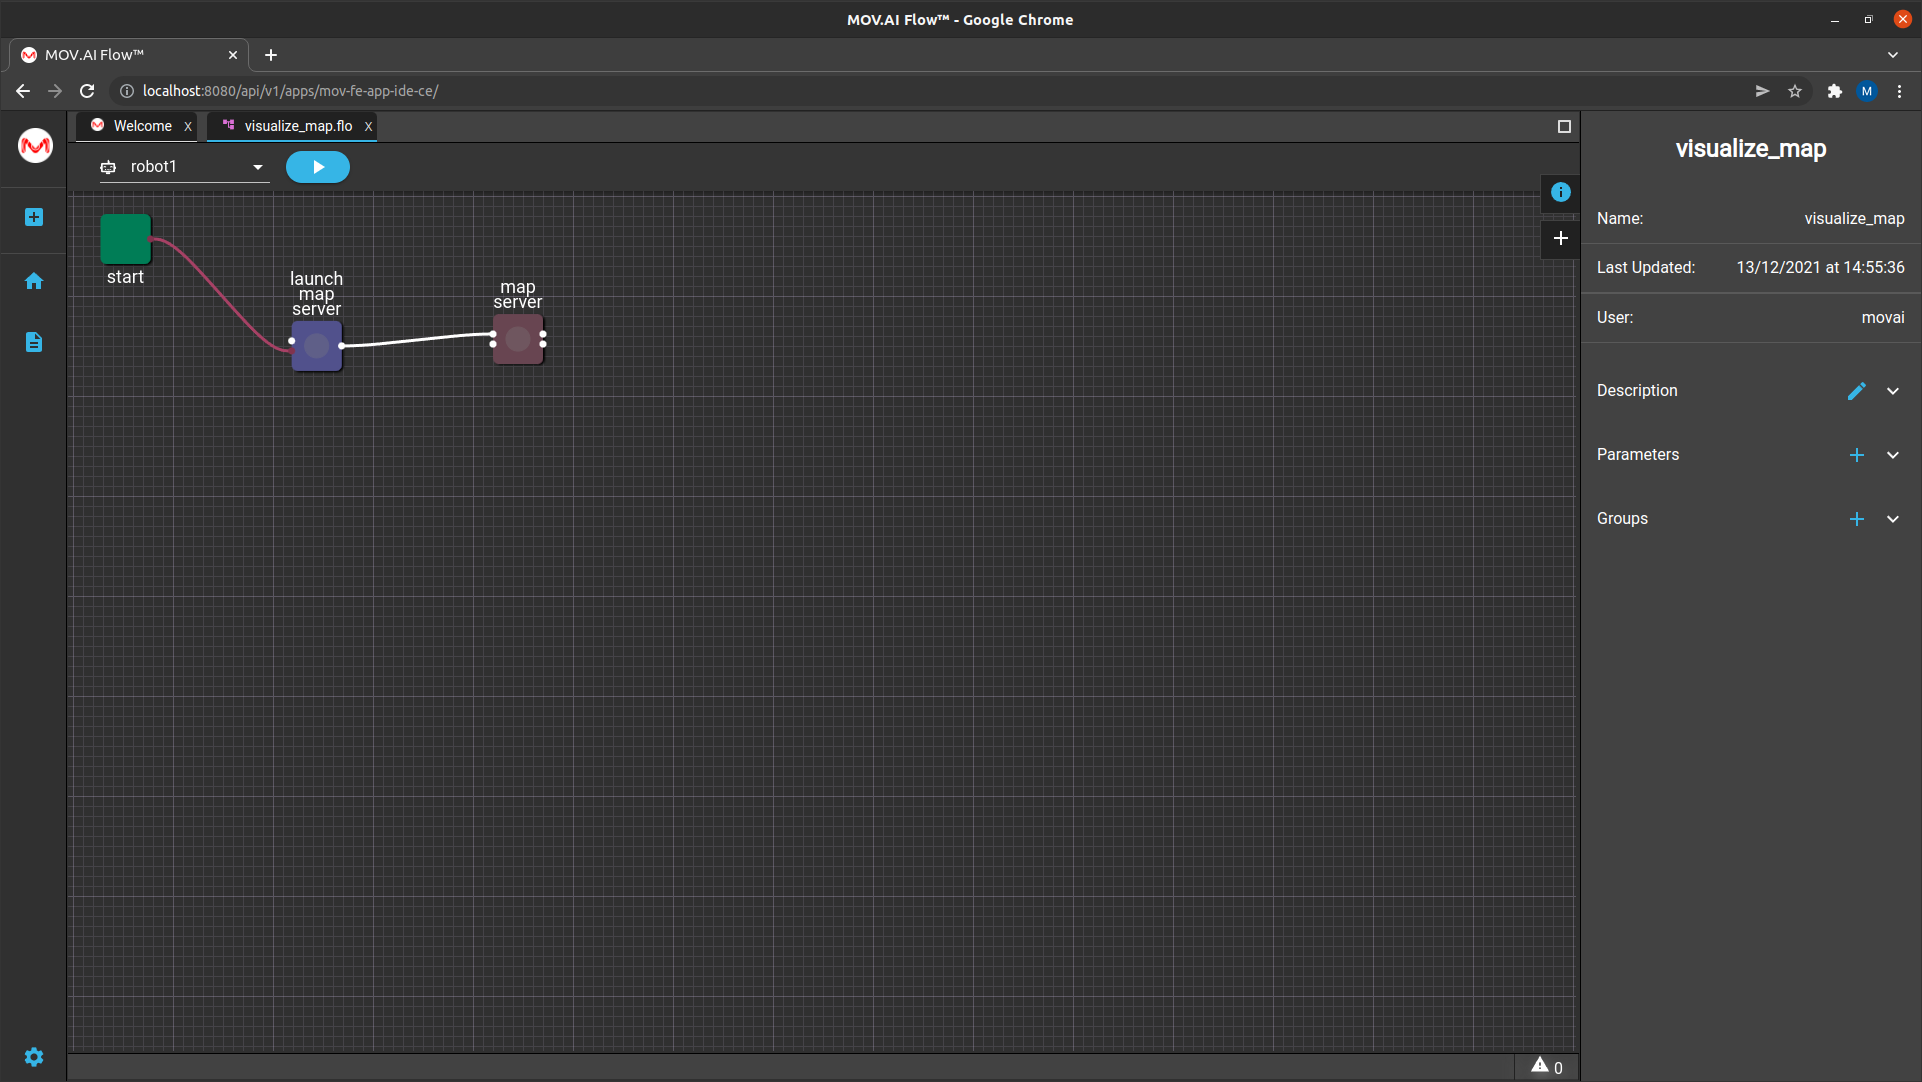
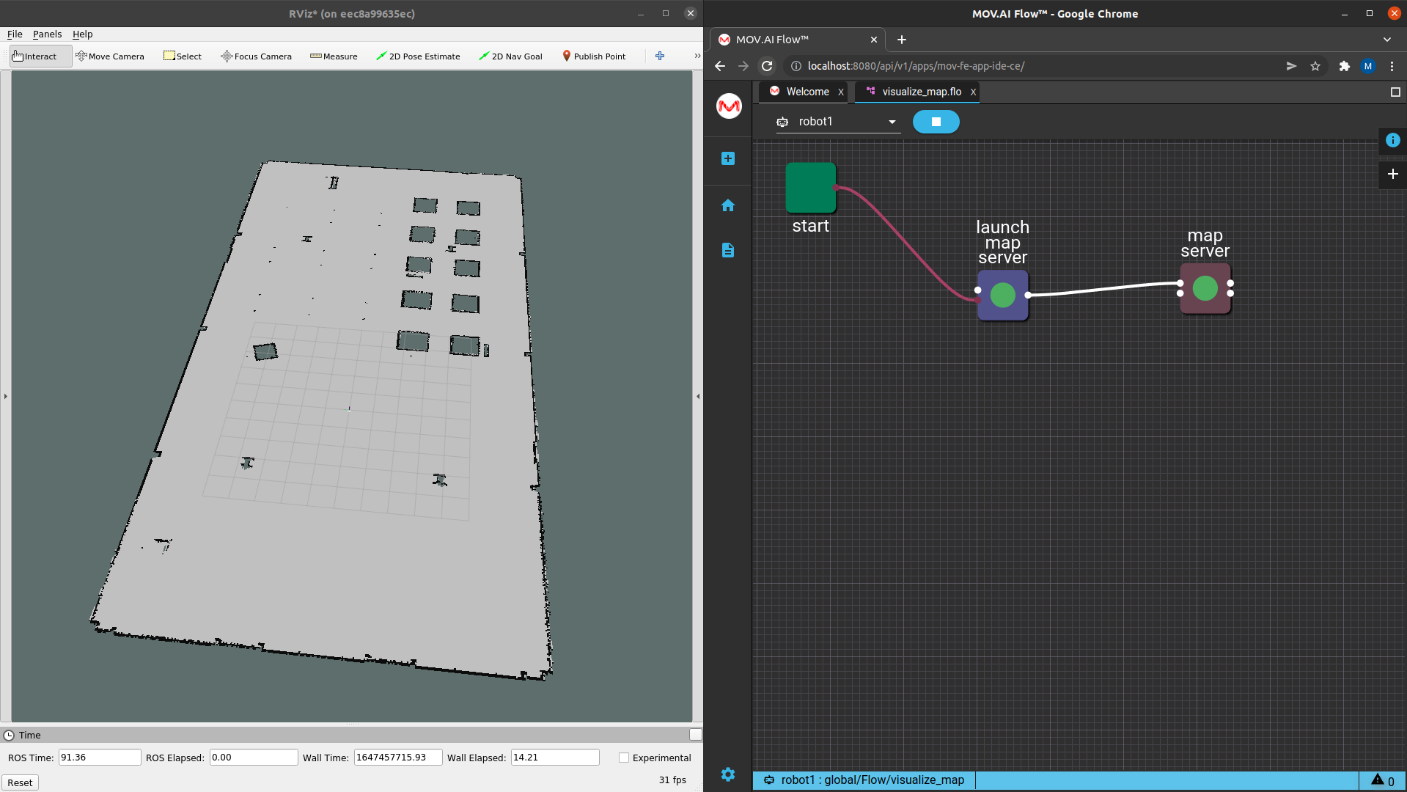
- Open the flow named visualize_map. The following displays –
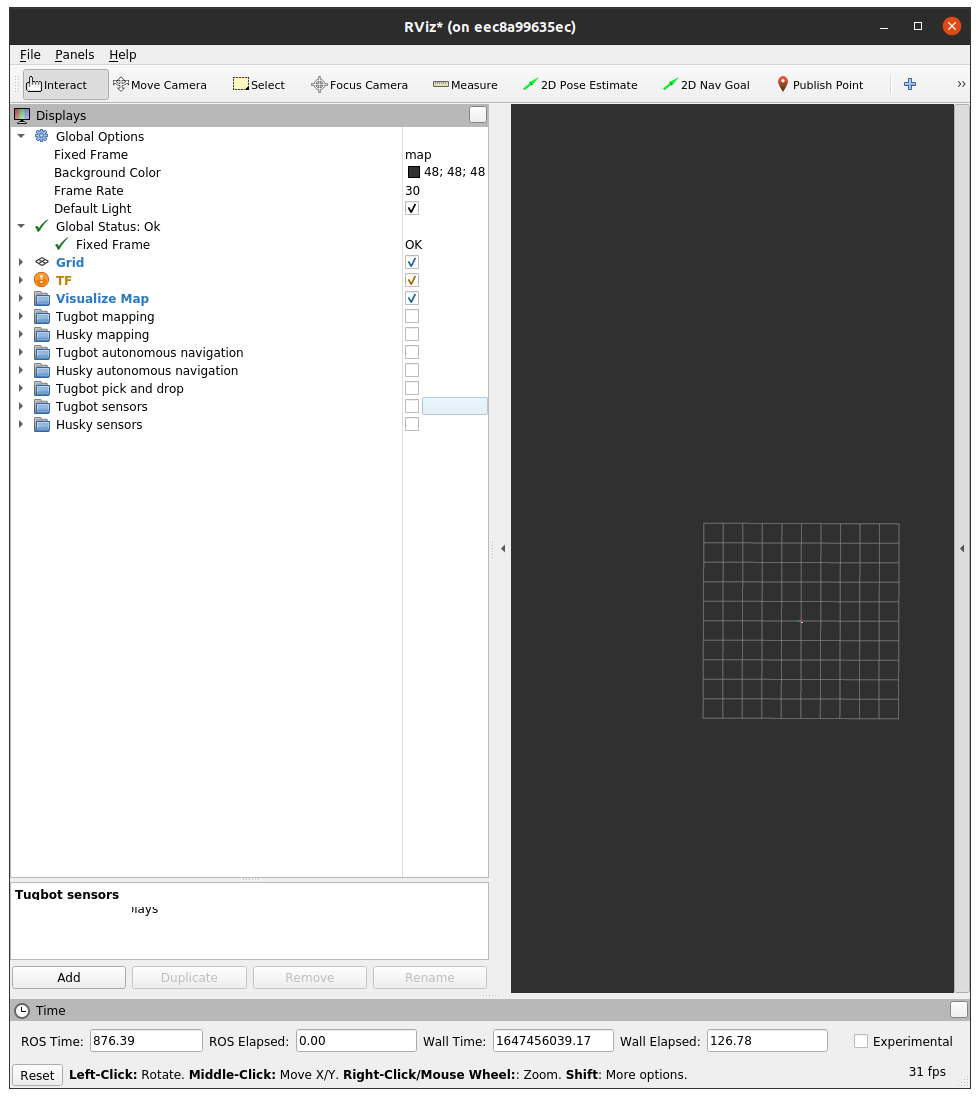
- In RViz, uncheck the checkbox named Husky mapping and mark the Visualize Map checkbox, as shown below –
- Display the husky_mapping flow by clicking its tab (it is still open), click on the map saver node to see (remember) what the name of the saved map in the map_name parameter is, as shown below –
- Highlight and copy this name (Ctrl + C).
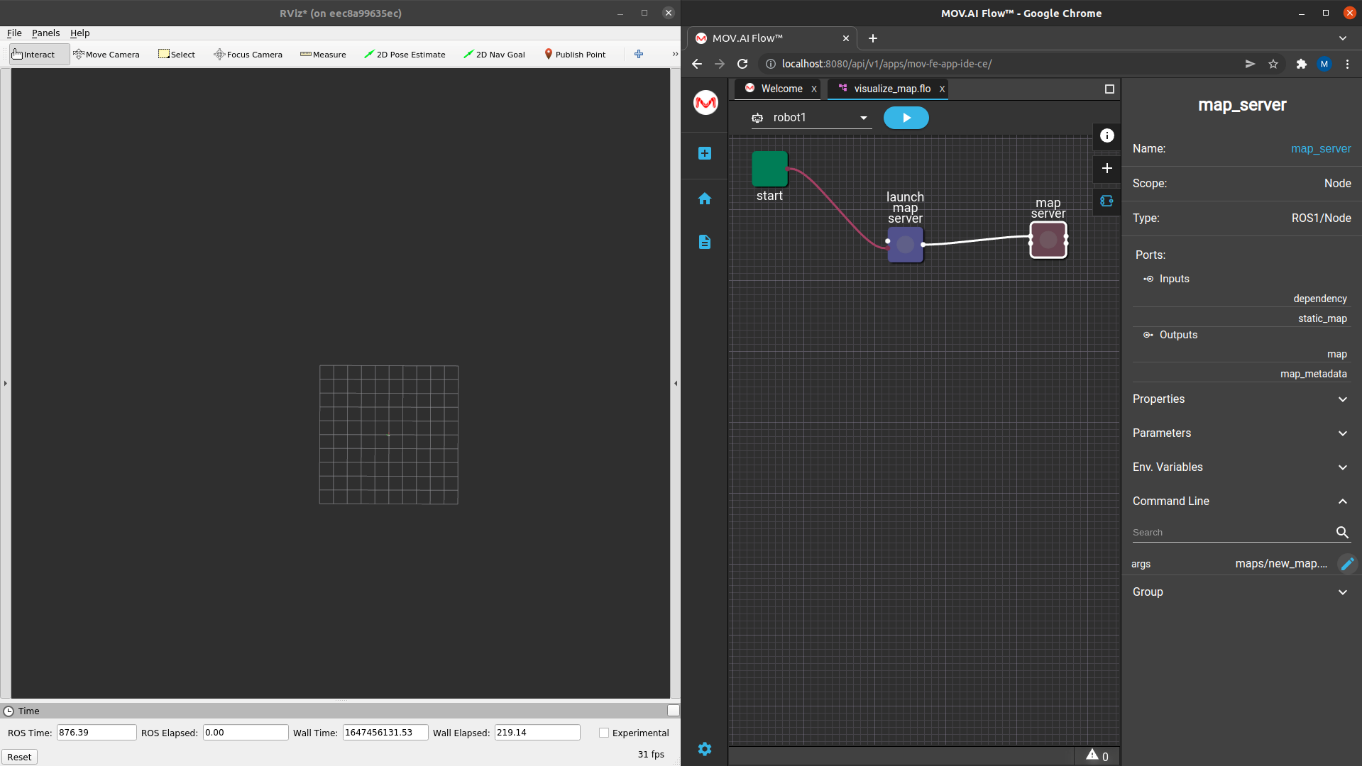
- Display the visualize_map flow by clicking on its tab (it is still open), click on the map server node of the flow to display its properties pane.
- Expand its Command Line in the right pane, as shown below –
- Click the Edit
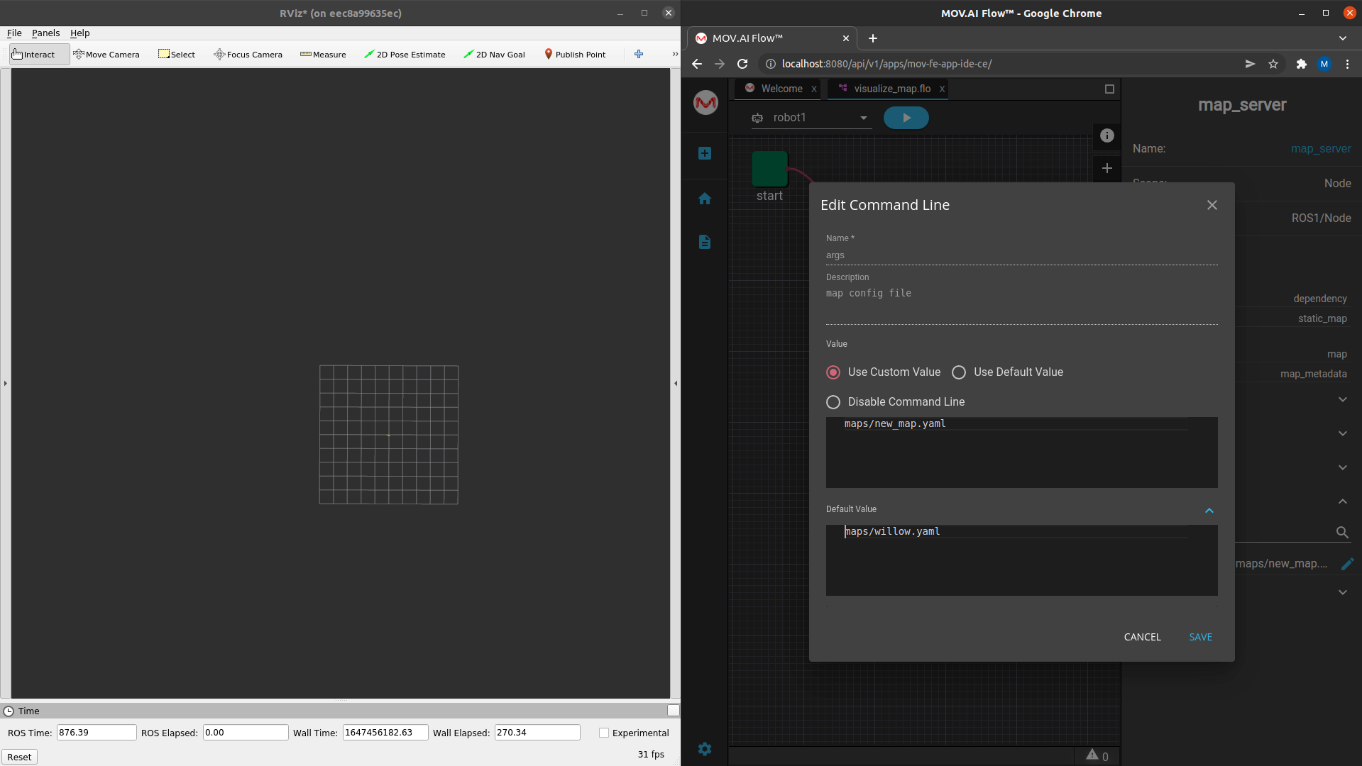
 button on the right of the args command line. The following displays –
-
By default the command line’s value is maps/new map.yaml. Copy into here the map_name that you copied of the husky_mapping flow.
-
Click the SAVE button.
-
Click the Play
 button to run the flow. A message is displayed indicating that the other flow ( husky_mappingflow) is running.
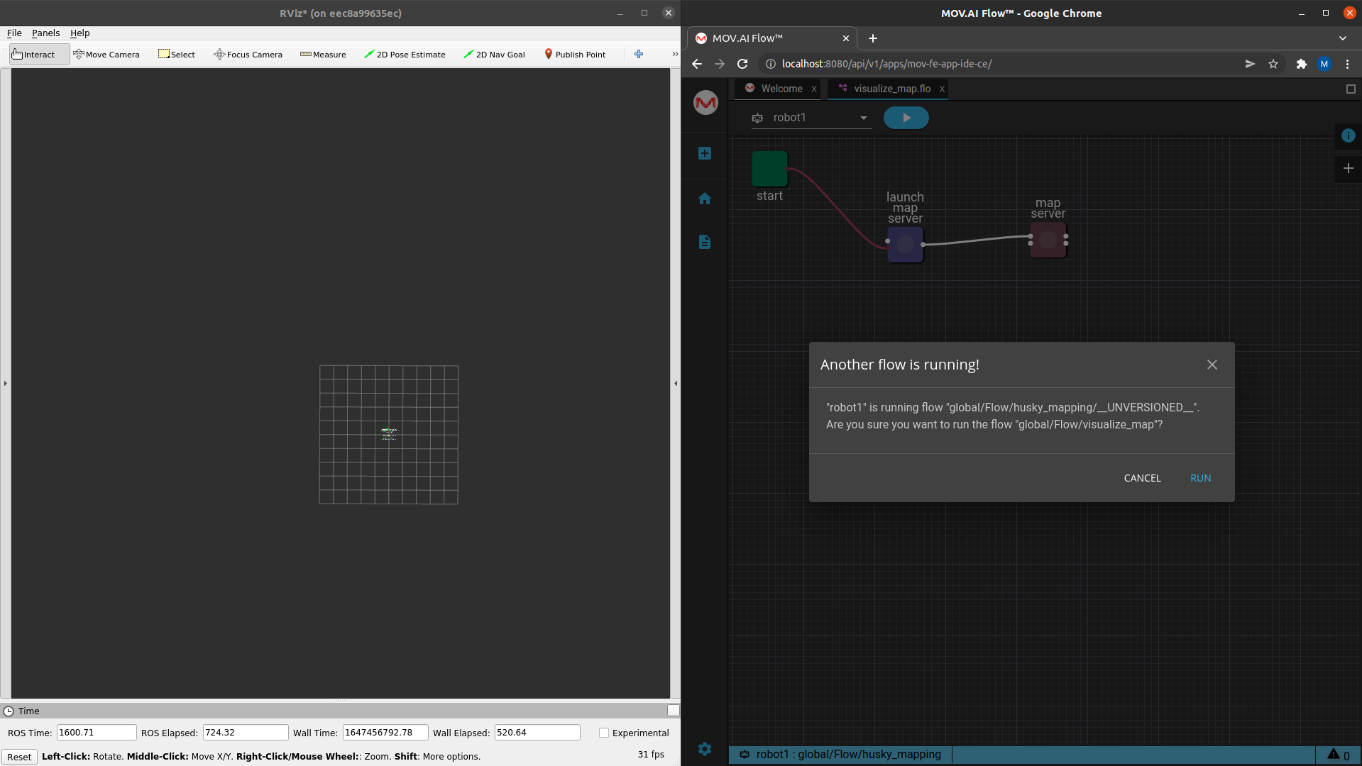
- Click the RUN button to close that flow and run the visualize_map flow.
RViz should now display the saved map that was created.
Updated 9 months ago
